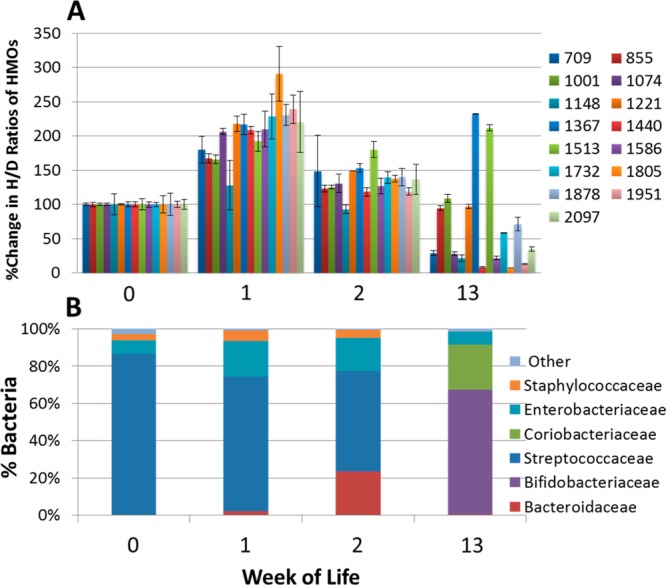
Figure 1.

Changes in oligosaccharide intensities and bacterial population in the feces of Infant A. (A) Percent change in H/D ratios of HMOs in the feces of Infant A at weeks 0, 1, 2, and 13. Intensities were obtained using MALDI FT-ICR MS with n = 3. H/D ratios were normalized to week 0, set at 100%. Each bar represents an oligosaccharide nominal mass. (B) Corresponding fecal bacterial population of Infant A using 16S rDNA pyrosequencing.
