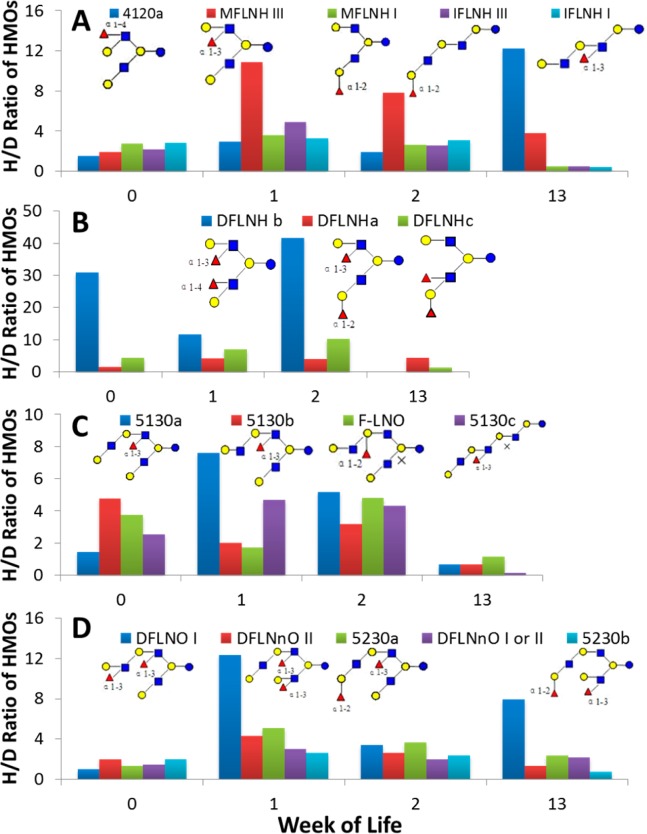
Figure 9.
H/D ratios of four isomeric groups of oligosaccharides in the fecal HMO profile of Infant A. H/D ratios were calculated using nano-HLPC chip/TOF MS data. (A) Five isomers of m/z 611 ([M + 2H]2+, z = 2, M = 1220.4542, sixth bar from the left in each week in Figure 1A). (B) Three isomers of m/z 684 ([M + 2H]2+, z = 2, M = 1366.5121, seventh bar from the left in Figure 1A). (C) Four isomers of m/z 794 ([M + 2H]2+, z = 2, M = 1585.5864, tenth bar from the left in Figure 1A). (D) Five isomers of m/z 867 ([M + 2H]2+, z = 2, M = 1731.6443, 11th bar from the left in Figure 1A). M = monoisotopic (neutral) mass.

