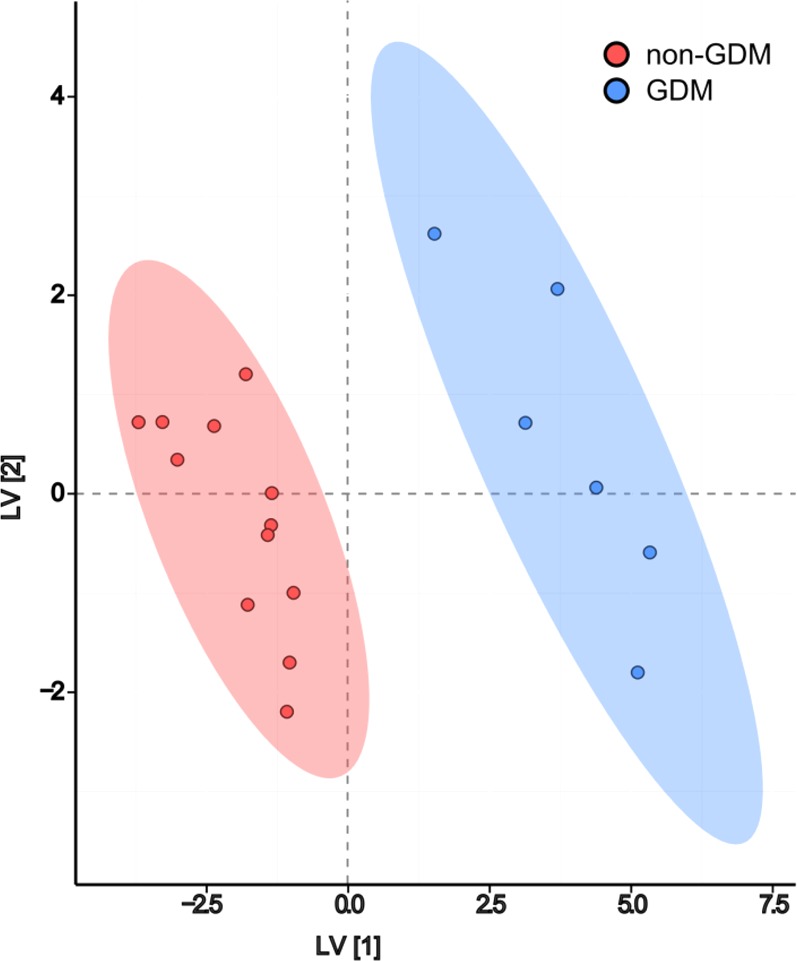
Figure 1.

Scores plot displaying discrimination between women with and without GDM based on 27 selected colostral whey proteins using orthogonal signal correction partial least-squares discriminant analysis. Edge width and color encode the magnitude and direction of partial correlations (P < 0.05) among all selected proteins based on O-PLS-DA. Vertex size and shape display the magnitude and direction of the fold-difference in protein expression in colostral whey from women with GDM relative to women without GDM (mean GDM/mean non-GDM). Significantly differentially expressed proteins (Power Law Global Error Model, Padj ≤ 0.05) are identified with thick black borders.
