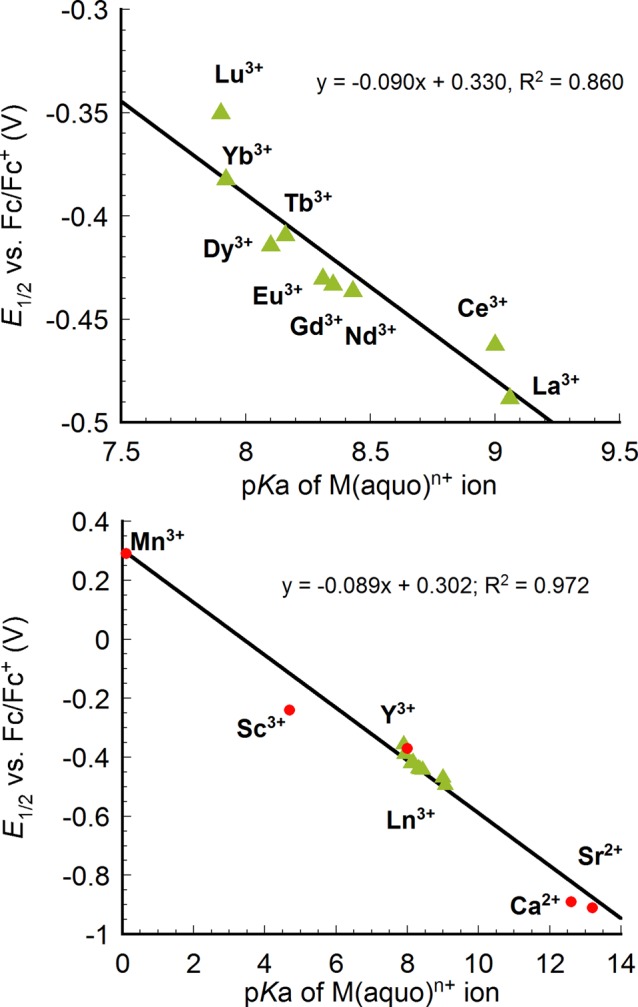
Figure 4.

Plot of reduction potentials of [LnMn3O4] (green triangle(top and bottom)) and previously reported [MMn3O4] complexes (red circle(bottom)) vs pKa of the corresponding M(aqua)n+ ion as a measure of Lewis acidity. Potentials were referenced to Fc/Fc+.
