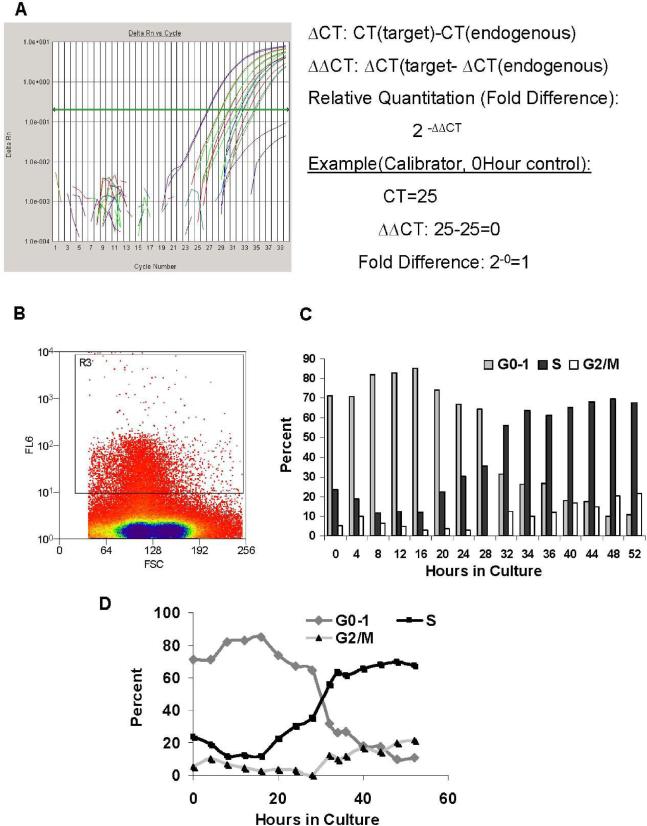
Figure 1. Methods. (A) Quantitation of Gene Expression.
Gene expression was calculated, using Applied Biosystem's Delta, Delta CT (ΔΔCT) method from results obtained on the ABI 7000 Sequence Detection System (Applied Biosystems, Foster City, CA). Relative quantitation (RQ) or “fold difference” is represented in relation to the 0Hour, non-cultured control. (B) Lin−Sca-1+ Histogram (sort). Cells were sorted based on Sca-1+ characteristics. FL6= Allophycocyanin; FSC=Forward Scatter. (C) Cell cycle Kinetics: Lin−Sca-1+ Propidium Iodide Treatment Through Cell Cycle in IL-3, IL-6, IL-11, SCF (Bar Graph). Cycling status of the cells was analyzed at different times in culture by flow cytometry of propidium iodide labeled cells. (D) Cell cycle Kinetics: Lin−Sca-1+ Propidium Iodide Treatment Through Cell Cycle in IL-3, IL-6, IL-11, SCF (Line Graph). Cycling status of the cells was analyzed at different times in culture by flow cytometry of propidium iodide labeled cells

