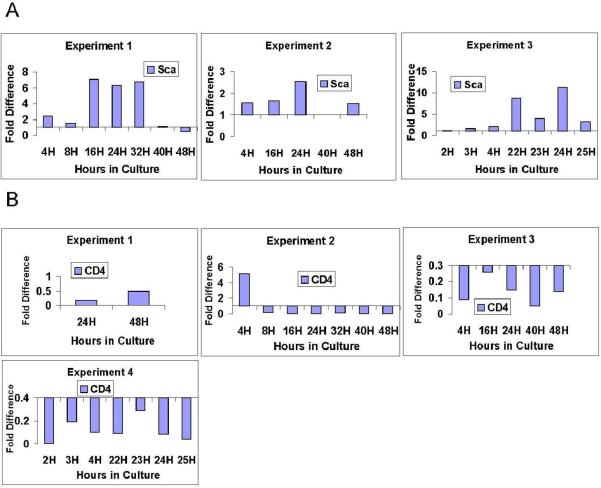
Figure 4. Gene Expression Through Cell Cycle: Lin-Sca-1+ in Culture with IL-3, IL-6, IL-11, SCF.
Expression patterns in individual experiments are represented using quantitation methods shown in Figure 1. Fold difference is expressed in relation to 0 hour sample (calibrated to a value of 1). The 0 hour control is represented as a baseline of 1 at the X axis. (A) Sca1 expression through cycle. (B) CD4 expression through cycle.

