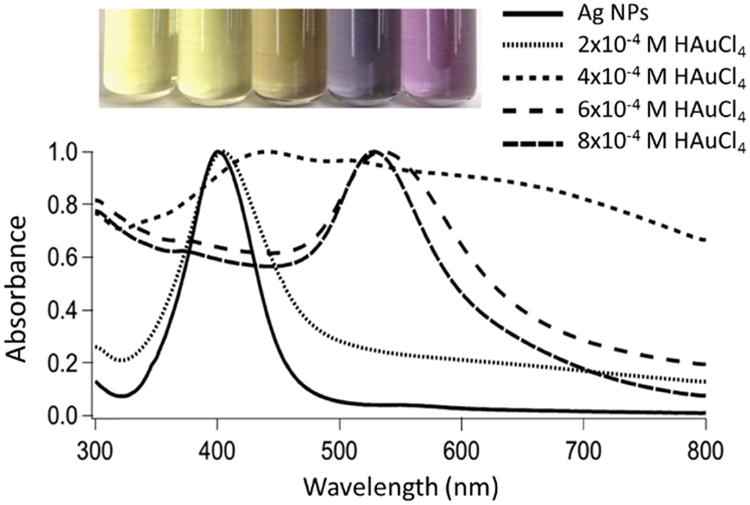
Figure 3.

Representative optical images and UV-vis absorption spectra of Ag-Au BNPs with increasing Au fractional composition as determined by EDX. All spectra are normalized to their localized surface plasmon peak maxima. The nanoparticles were prepared by heating 1 mL of ≈ 1 nM (OD ≈ 12) 22 nm Ag nanoparticles to ∼ 100 °C and adding HAuCl4 (1 to 8 μL; 0.1 M) to the hot solution. The inset is a digital photograph of Ag and Ag-Au (made with 2 ×10⁻⁴ M, 4 × 10⁻⁴ M, 6 × 10⁻⁴ M, and 8 × 10⁻⁴ M of HAuCl4) nanoparticles. For the UV-vis absorption spectra, the black solid line at 400 nm represents Ag nanoparticles and the dotted lines correspond to Ag-Au nanoparticles made with 2 × 10⁻⁴ M, 4 × 10⁻⁴ M, 6× 10⁻⁴ M, and 8 × 10⁻⁴ M of HAuCl4, respectively.
