
Figure 4.
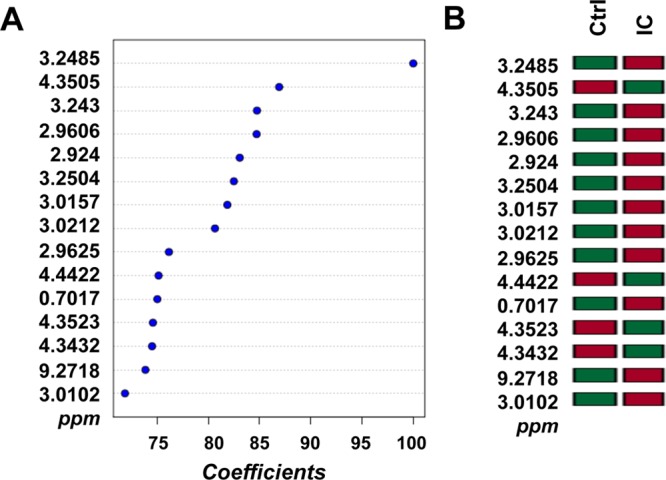
NMR spectra segregating IC from controls. (A) The major contributing NMR signals identified by PLS-DA. The regression coefficients represent the highest contributing signals from which the IC and control groups could be distinguished. (B) The colored boxes indicate the relative concentrations of the corresponding metabolite in each group. Red and green denote high and low concentrations, respectively. The top 15 NMR peaks are considered to be significantly different between the two groups based on their coefficients (>70).