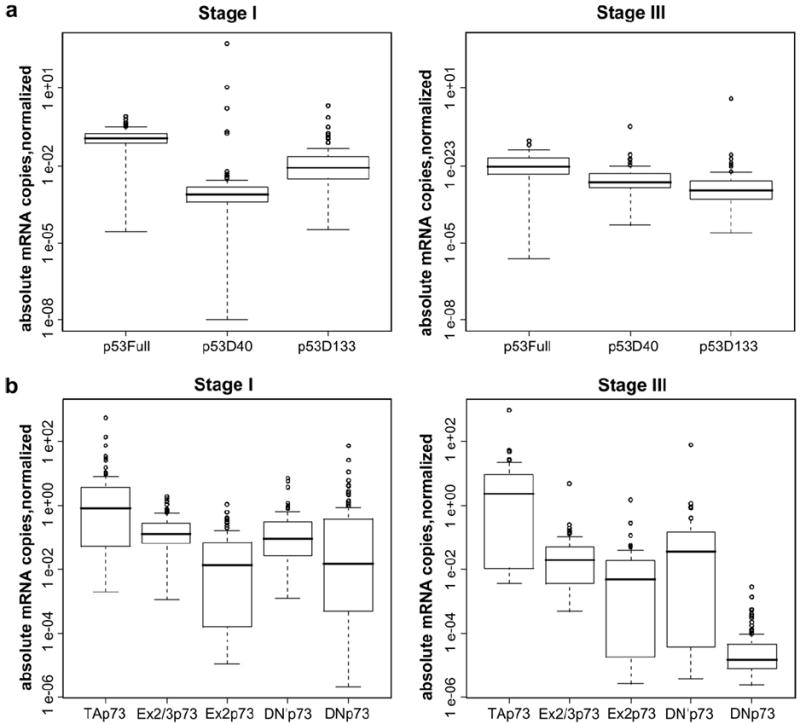
Fig. 1.

(a) Box plot diagrams showing the expression levels of p53, ΔN40 and Δ133 isoforms in 84 stage I (left side) and 86 stage III (right side) ovarian cancer biopsies. (b) Box plot diagrams showing the expression levels of TAp73, ΔTAp73 and ΔNp73 in 84 stage I (left) and 86 stage III (right) ovarian cancer biopsies. After normalisation of each sample to its own set of housekeeping genes, data are expressed as absolute copy numbers on a logarithmic scale. The line within the boxes indicates the median. The top edge of the boxes represents the 75th percentile, the bottom edge the 25th percentile. The range is shown as a vertical line. Outliers (circles) are defined as 1.5-fold above or below the 75th and 25th percentile values.
