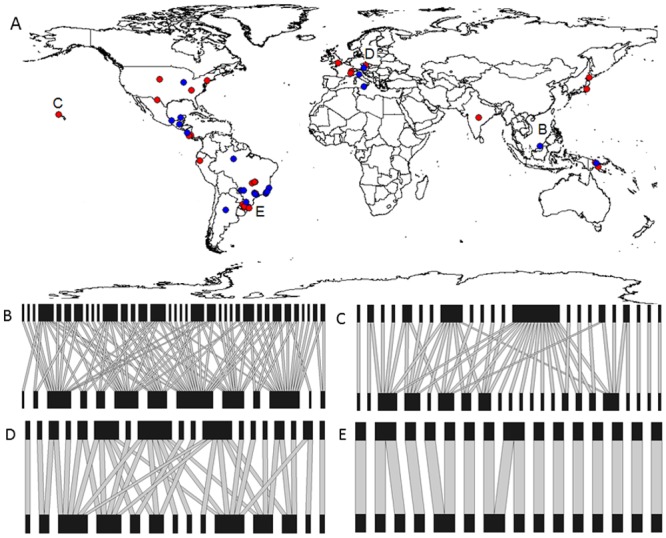
Figure 2. Global distribution of the (A) 72 community-wide plant-herbivore networks used in the current study.

Some of the networks localities are indistinguishable at this map scale. Blue plots represent endophagous networks and red plots represent exophagous networks. (B-E) Examples of plant-herbivore networks with different levels of land use intensity (LUI) and specialization. Herbivores are on the top and plants on the bottom of the networks. The networks are arranged in descending order of residual connectance. (B) Network of Nakagawa et al. [45] localized in habitat with LUI level 1; (C) Network of Henneman and Memmot [46] localized in habitat with LUI level 2; (D) Network of Masetti et al. [47] localized in habitat with LUI level 3; (E) Network of Santos et al. [48] localized in habitat with LUI level 4.
