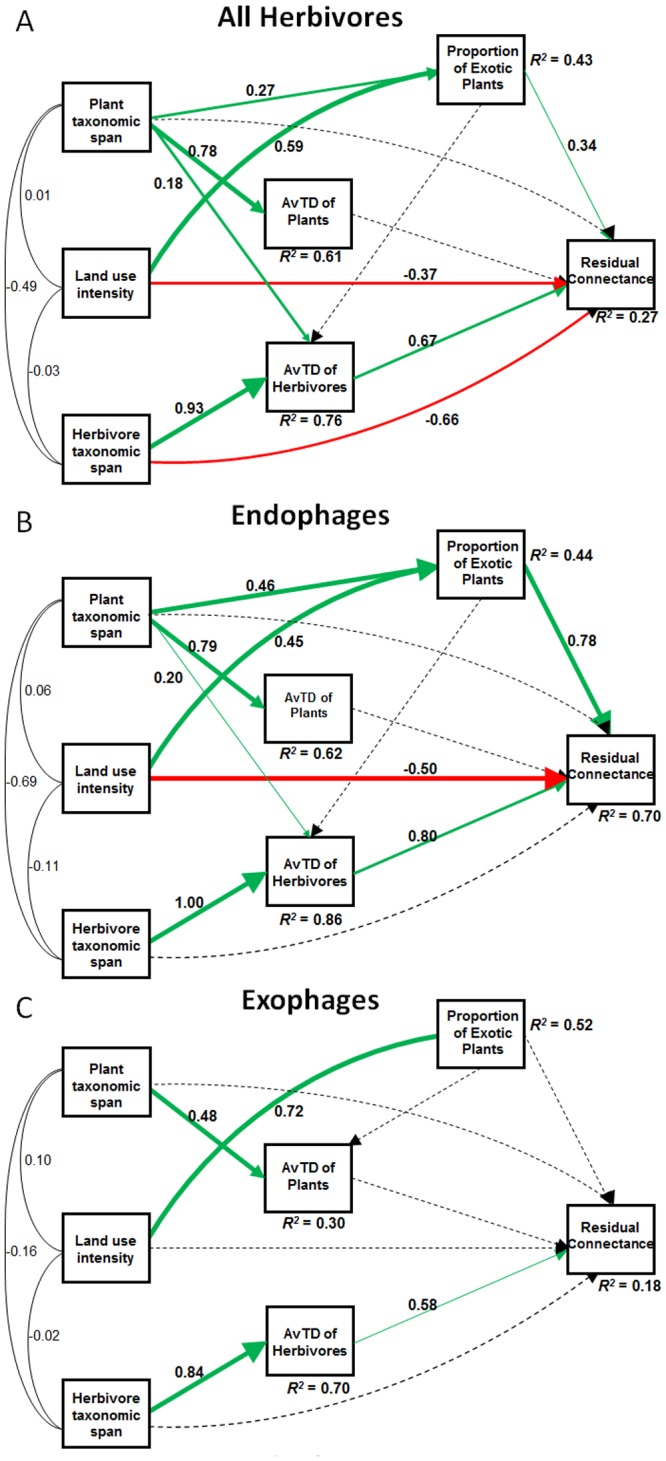
Figure 3. Path analyses of residual connectance in plant-insect networks of (A) all herbivores, (B) endophages, and (C) exophages, explained by land use intensity, proportion of exotic plants, plant taxonomic span, herbivore taxonomic span, and average taxonomic distinctness (AvTD) of plants and of insects.

Numbers on paths between variables are standardized path coefficients (scaled by the standard deviations of the variables). Green arrows represent positive effects and red arrows represent negative effects. The thickness of lines and arrows is proportional to effect size.
