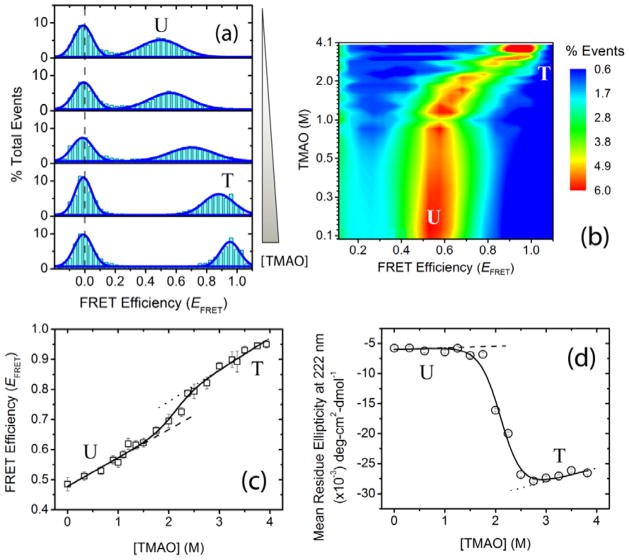
Figure 2.
Osmolyte-induced two-state folding of α-synuclein. Single-molecule and ensemble experiments were performed in αβγ buffer at pH 10.5 ± 0.1. (a) Representative smFRET histograms as a function of increasing trimethylamine N-oxide (TMAO) concentration (0, 1, 2, 3, and 3.9 M). The dashed gray line shows the expected zero peak position; peaks for U and T protein states are indicated. (b) [TMAO]-EFRET contour map, color-coded on the basis of fractional population. (c) α-Synuclein isothermal smFRET TMAO titration data. (d) Osmolyte-forced folding of α-synuclein using TMAO, monitored via far-UV CD spectroscopy. The solid curves in (c) and (d) represent the global NLS fits of the data to a two-state linear extrapolation model (LEM);[11] the dashed and dotted lines are the baselines for U and T, respectively.

