Figure 9.

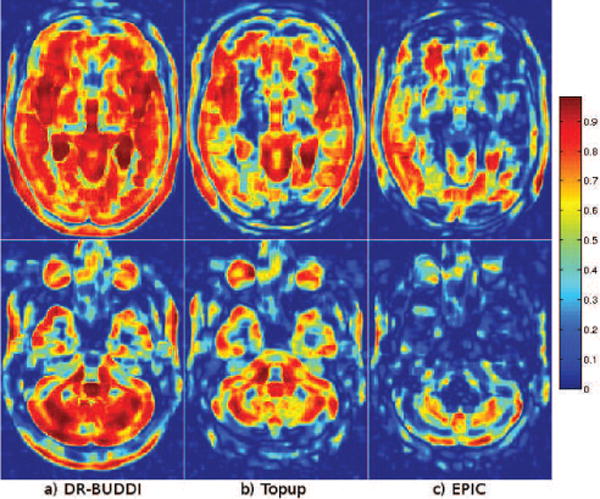
Local cross-correlation maps between different corrected images (AP) and the structural image. Warmer colors indicate higher local agreement between the corrected and the structural images.

Local cross-correlation maps between different corrected images (AP) and the structural image. Warmer colors indicate higher local agreement between the corrected and the structural images.