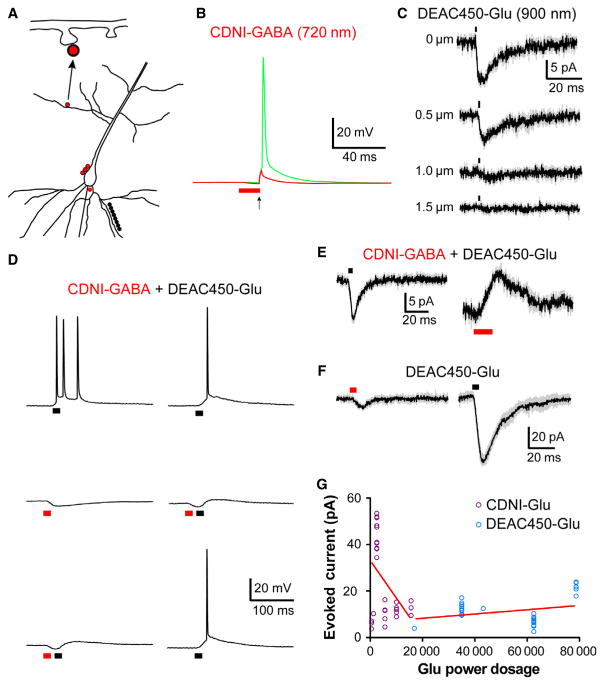
Fig. 7.
Two-color 2P uncaging. (A) A schematic representation of the various photolysis positions on CA1 pyramidal neurons of the two mode-locked Ti: sapphire lasers used in (B)–(F). The two uncaging wavelengths are color-coded in each part with red representing the 720-nm laser and black the 900-nm laser. Neurons were imaged with a third laser at 1070 nm. For (C) and (F) the same points are targeted with both uncaging lasers. (B) CDNI-GABA (0.2 mM) was uncaged with 720 nm light (2 ms, 60 mW) at 12 points around the axon hillock, which generated an inhibitory input capable of blocking (red trace) electrically evoked action potentials. The green trace represents a control action potential in which only the electrical stimulus (2 ms, 500 pA) was applied. The pyramidal cell was held at −55 mV. (C) DEAC450-Glu (1 mM) was uncaged with 900-nm light (1 ms, 35 mW) at a single spine head. Each trace represents an average of 5 or 10 responses from one cell (grey represents SEM), which is representative of four cells on which this experiment was performed. (D) CDNI-GABA (1 mM) and DEAC450-Glu (0.6 mM) were co-applied to a slice and a CA1 pyramidal cell (held at −60 mV) was recorded from. Irradiation at 900 nm at 10 spines along a basal dendrite (1 ms, 120 mW) produced sufficient depolarization to evoke a burst of action potentials (top left trace). Irradiation at 720 nm at three points adjacent to the soma (5 ms, 125 mW) generated an inhibitory input of several millivolts (middle left). When these two inputs were paired in rapid succession, the action potentials were blocked (bottom left trace). Action potentials were blocked reversibly by interleafing dual-color irradiation at 720 and 900 nm (right middle trace) with 900 nm photolysis (right top and bottom traces). (F) CDNI-GABA (1 mM) and DEAC450-Glu (0.6 mM) were co-applied to a slice, and selectively activated at three points along a CA1 pyramidal cell soma (held at −50 mV). Stimuli were 720 nm, 5 ms for 90 mW and 900 nm, 1 ms for 50 mW. Traces are an average of five responses from a cell with a holding potential of −50 mV, and are representative of responses observed in four cells (grey indicates SEM). (F) DEAC450-Glu (0.5 mM) was uncaged at single spine heads; the same stimulus (5 ms, 50 mW) was used at both wavelengths. Uncaging at 900 nm evoked 30-fold larger response than that at 720 nm. Each trace is an average of five events from one cell, representative of six cells on which this experiment was performed (grey indicates SEM). Note that when a stimulus duration of 1 ms was used, DEAC450-Glu did not generate a measurable response at 720 nm (data not shown). Furthermore, the typical power dosage at 720 nm used to uncage CDNI-Glu (0.5–1 ms, 25–60 mW) did not produce any detectable 2P EPSCs from DEAC450-Glu. (G) Summary of all uncaging experiments for CDNI-Glu and DEAC450-Glu when uncaged at 720 nm at single spine heads. The evoked currents from many cells for CDNI-Glu and DEAC450-Glu uncaging at 720 nm (hence red lines for both data groups) are plotted vs. the ‘Glu power dosage’ (the caged compounds are color-coded according to their absorption spectra). This latter quantity is the product of the (power)2 × (time) × [cage]. As DEAC450 is ~ 10× more photoactive for 2P excitation (Olson et al., 2013b) this adjustment factor is also used. The graph shows an n of 35 for each cage compound. The linear regression line for each compound was computed and an analysis of covariance showed the two slopes were significantly different (F = 12.76, P = 0.00075).

