Figure 2.
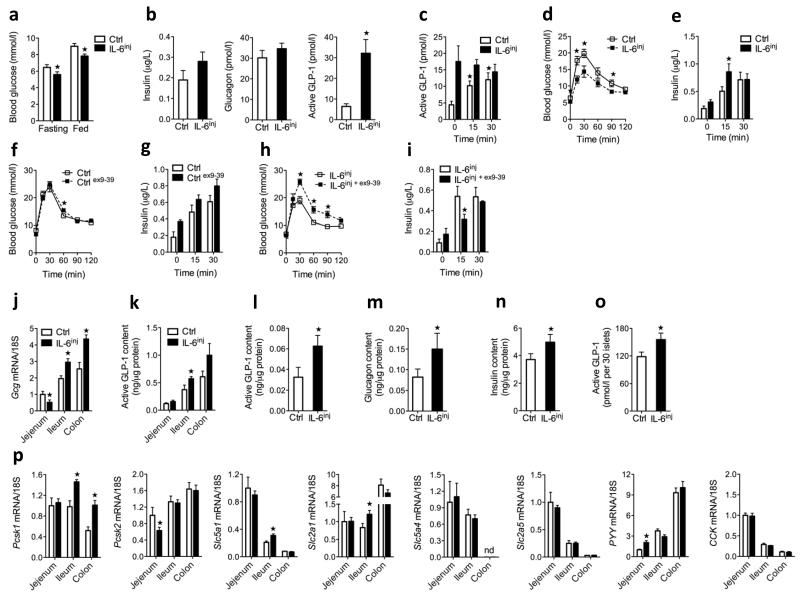
Effect of 1-week IL-6 injections on glucose homeostasis and GLP-1 production. (a) Fasting and fed blood glucose concentrations in male control mice and IL-6inj mice (n = 8). (b) Fasting plasma hormones in male control and IL-6inj mice (n = 6–8). (c) Plasma GLP-1 concentrations in response to oral glucose in male control and IL-6inj mice (n = 8). (d) Intraperitoneal GTT (ipGTT) (left) and plasma insulin in response to intraperitoneal glucose (right) in male control and IL-6inj mice (n = 8). (e) IpGTT (left) and plasma insulin in response to intraperitoneal glucose (right) in male control mice in the absence or presence of exendin (ex) (9–39) (n = 4). (f) IpGTT (left) and plasma insulin in response to intraperitoneal glucose (right) in male IL-6inj mice in the absence or presence of exendin (9–39) (n = 4). (g) Intestinal proglucagon (Gcg) mRNA expression (left) and intestinal GLP-1 content (right) in male control and IL-6inj mice (n = 8). (h) Pancreatic GLP-1 (left), glucagon (middle) and insulin (right) abundance in male control and IL-6inj mice (n = 8). (i) GLP-1 release over 24 h in isolated mouse islets from male control and IL-6inj mice (n = 5 PER GROUP). (j) Intestinal mRNA expression in male control and IL-6inj mice. Data are expressed as a fold of the jejenum control (n = 8). ND, not detectable. Data represent means ± s.e.m. *P < 0.05, determined by Student’s t test comparing control to IL-6inj mice.

