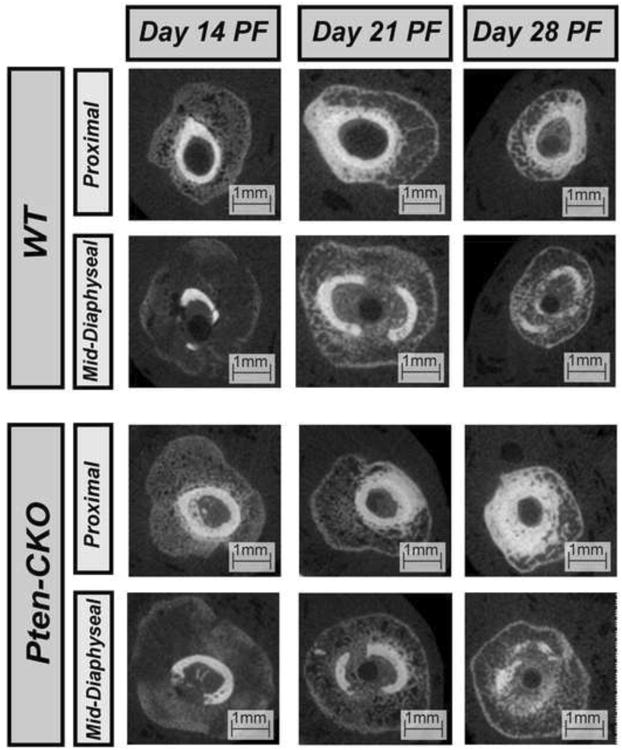
Figure 3.

Transverse μ-CT images of the proximal and mid-diaphyseal sections of select WT callus (Top) and Pten-CKO callus (Bottom) femurs at days 14, 21, and 28 PF. Increased mineralization and a reduction in callus size can be seen by day 28 PF in both callus Pten-CKO and WT femurs.
