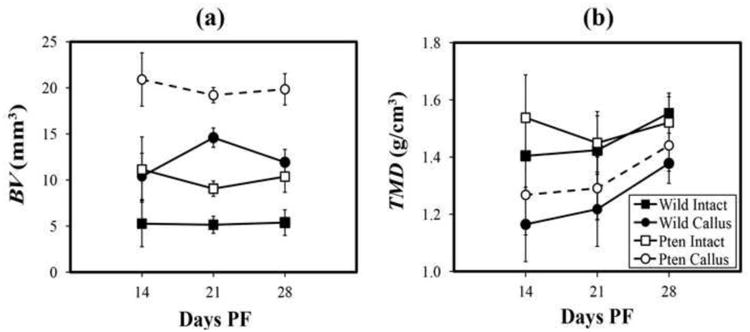
Figure 6.

a. Bone volume, BV, versus days PF, with 95% CIs labeled. No changes were found in BV over the duration of the experiment in any of the groups (p=0.85). BV of intact and callus Pten-CKO femurs were nearly twice their respective WT counterparts at 28 days PF (p<0.01); and, BV of callus femurs of both Pten-CKO and WT were roughly twice their respective contralateral intact femurs (p<0.01).
b. Tissue mineral density, TMD, versus days PF, with 95% CIs labeled. TMD of intact femurs of both Pten-CKO and WT was found to significantly increase with time (slope 0.06, 95%: 0.01, 0.10, p=0.019). TMD of callus femurs of both Pten-CKO and WT significantly increased with time with a slope 0.04 units larger than intact femurs (95% CI: 0.02, 0.07, p=0.005). TMD of callus Pten-CKO femurs was significantly less than contralateral intact femurs at 14 and 21 days PF (p=0.009, p=0.010, respectively). TMD of callus WT femurs of the was significantly less than their respective contralateral intact femurs for all days PF (p=0.002, p=0.010, p=0.002, respectively).
