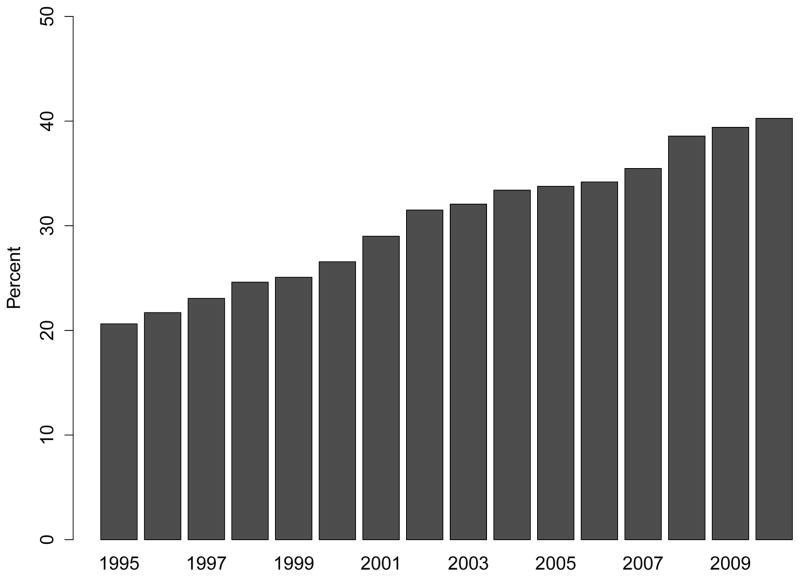
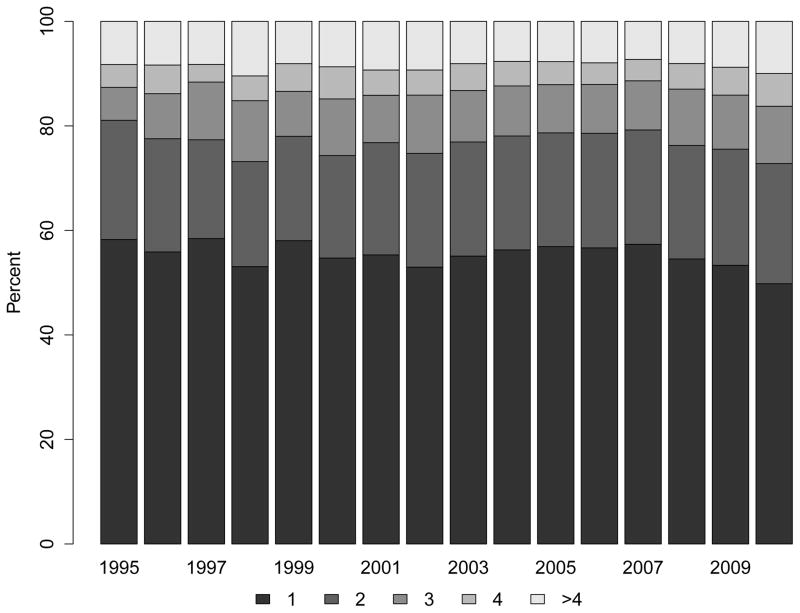
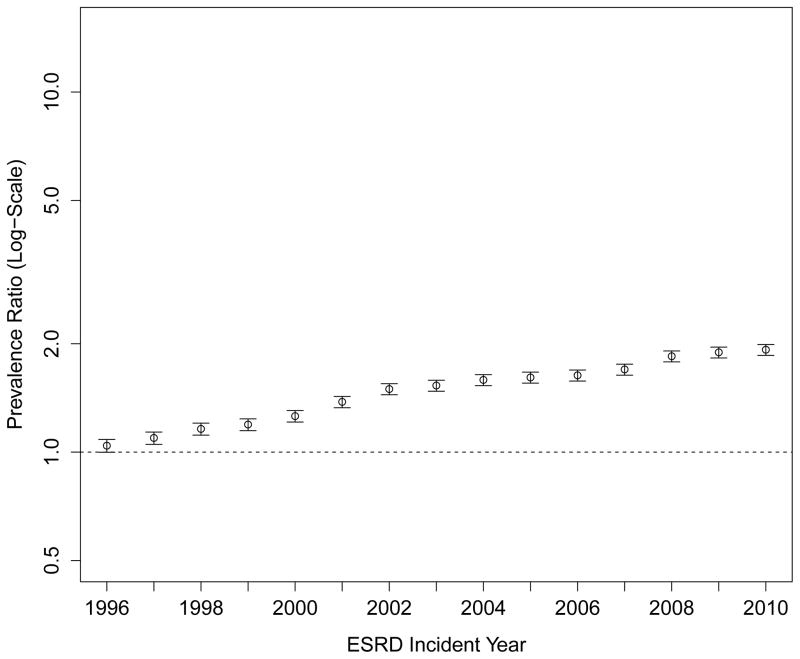
Figure 3. Trends in Blood Transfusion Use Prior to End-Stage Renal Disease.
Panel A: Proportion of Patients Receiving Any Blood Transfusion
Panel B: Number of Blood Transfusion Days (1; 2; 3; 4+)
Note: Compared with 2003–2006, the trend lines for transfusion use or number of transfusion days accelerated significantly in 2007–2010 (P<0.001 and P=0.04, respectively).
Panel C: Adjusted Prevalence Ratios of Any Blood Transfusion Prior to End-Stage Renal Disease (Referent: 1995)
Multivariable model adjusted for age, sex, race, Medicaid (“dual”) eligibility, comorbid diabetes, estimated glomerular filtration rate and body mass index at end-stage renal disease.


