
Figure 6.
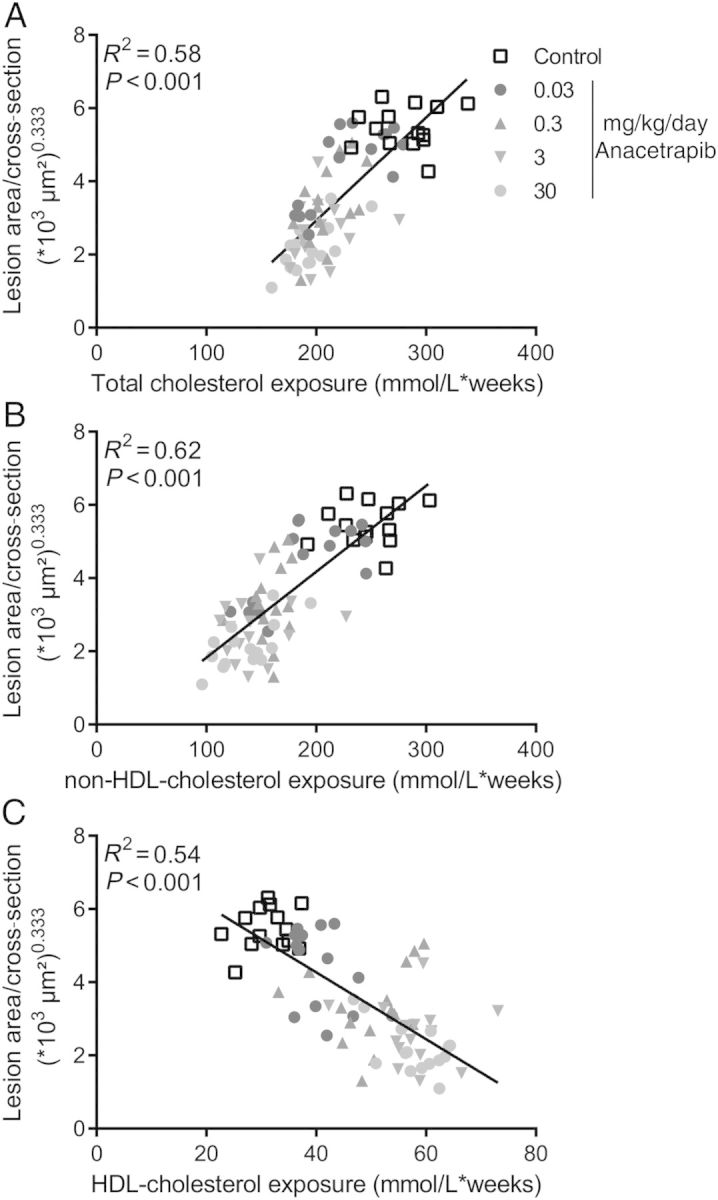
Correlation between plasma cholesterol exposure and lesion area. Linear regression analyses were performed on the cubic root of lesion area plotted against total cholesterol exposure (A), non-HDL-cholesterol exposure (B) and HDL-cholesterol exposure (C).