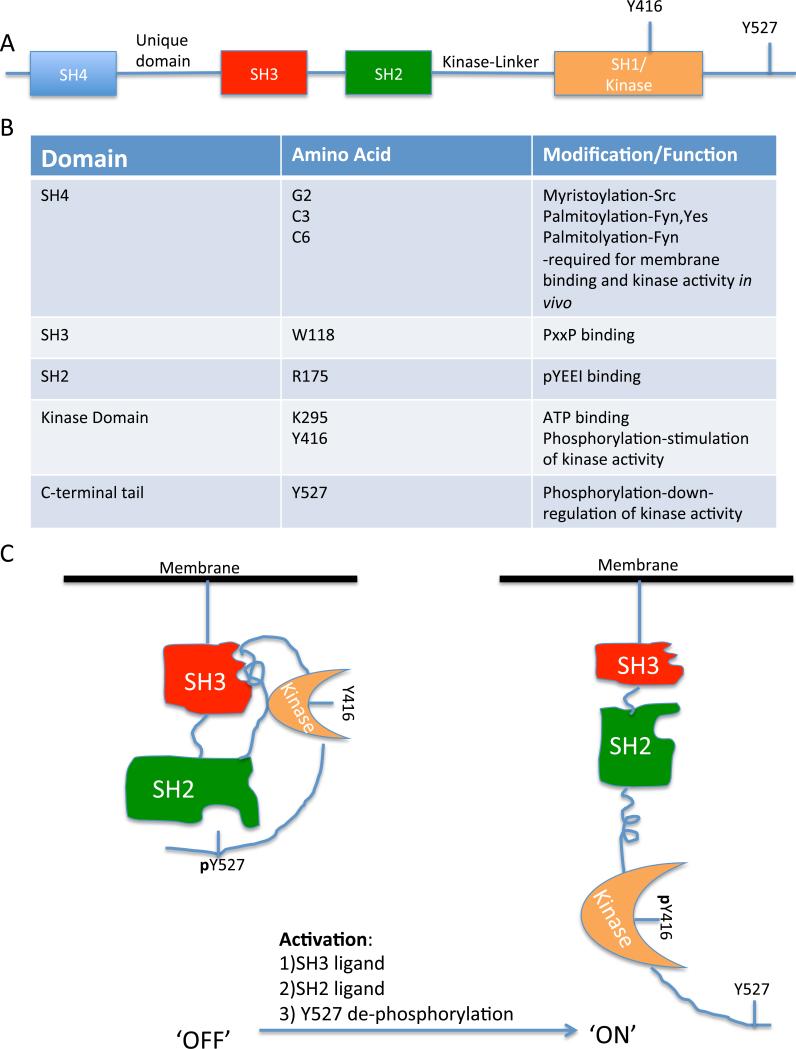
Figure 2.
Src structure and regulation. A) Schematic diagram of the linear domain arrangement of c-Src. B) Table showing key amino acids within each domain, and the function or post-translational modification of these residues. C) Model depicting the inactive, autoinhibitory conformation (‘OFF’) of Y527 c-terminal phosphorylated Src and the active, open conformation (‘ON’) of Y416 phosphorylated Src. Note that modular domain color-coding is synchronized with that shown in Figure 2A.

