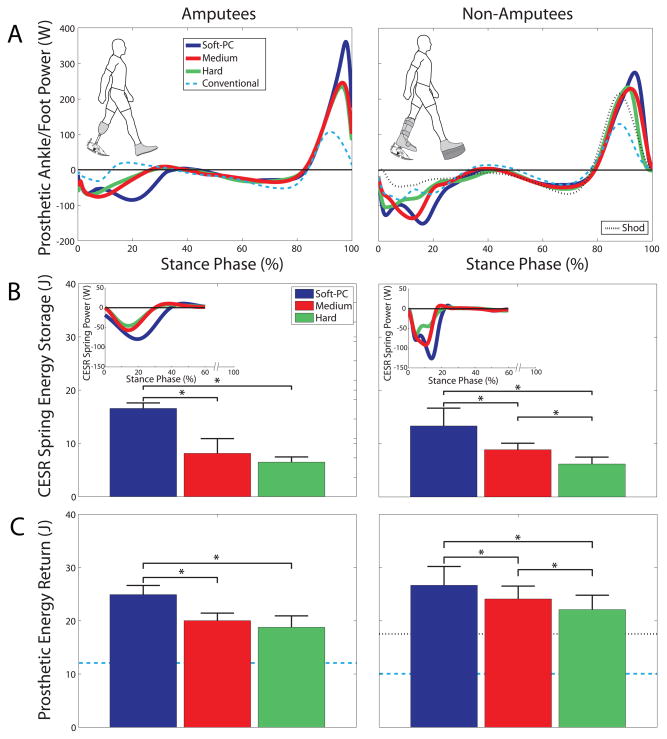
Figure 2.
Prosthesis power, energy storage and return. Average (A) ankle/foot power, (B) CESR spring energy storage and (C) prosthetic energy return are shown for Amputees (left column) and Non-Amputees wearing simulator boots (right column). The (A) ankle/foot power estimates all energy flow into and out of the foot, and the inset in (B) CESR spring power, represents energy storage contributions of just the spring. Power is plotted across stance phase from heelstrike to toe-off. Results from a Conventional passive prosthesis (dashed line) and typical Shod Non-Amputee gait (dotted line) are provided for reference. Prosthetic ankle/foot mechanics varied with spring stiffness in both Amputees and Non-Amputees: the softest, pre-compressed (Soft-PC) spring stored and returned the most energy, while the stiffest (Hard) spring stored and returned the least. In all figures, the results represent the means and standard deviations computed across all subjects.

