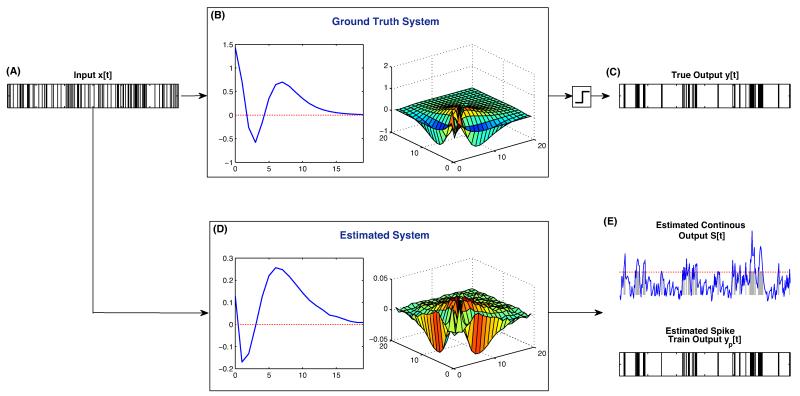
Fig. 1.
Representative ground truth and estimated system. Input spike train (A) is fed through the 2nd order nonlinear Volterra system, defined by the 1st and 2nd order kernels shown in (B), and then thresholded to generate the output in (C). The input and output point-process time series are then used to obtain the estimated PBV kernels shown in (D). The input is then fed through the estimated system to generate the estimated output in (E). The top plot in (E) shows the estimated continuous output () overlaid on the true output (in gray). The red vertical line shows the estimated threshold trigger value. The bottom plot in (E) shows the estimated spike-train output, . (For interpretation of the references to color in this figure legend, the reader is referred to the web version of the article.)

