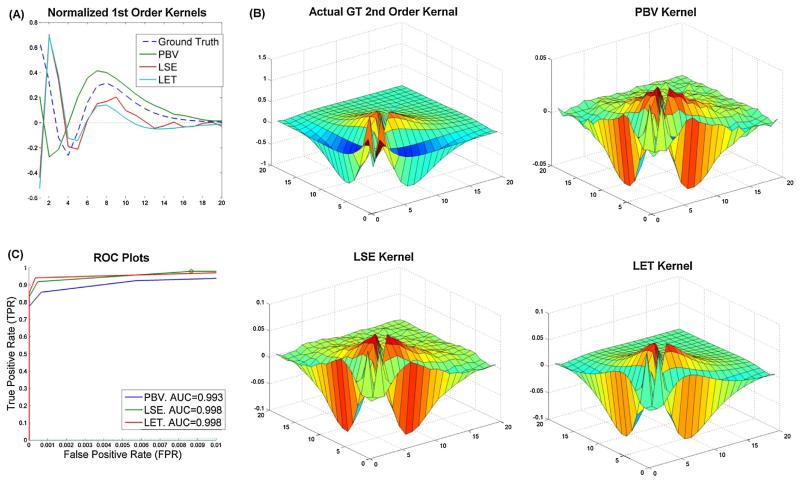
Fig. 2.
Comparison of results from 3 models for system in Fig. 1. (A) Ground truth and 3 estimated 1st order kernels. All 1st order kernels were normalized by their power to make comparison easier. Plot (B) shows the same for 2nd order kernels. Note that the diagonal of the 2nd order LET and LSE kernel was added to the 1st order kernel as these diagonals reflect 1st order dynamics (see text). (C) ROC plots for all three models. Note that the FPR (x-axis) extends only to.01 rather than 1 as in traditional ROC plots since the models were so accurate.

