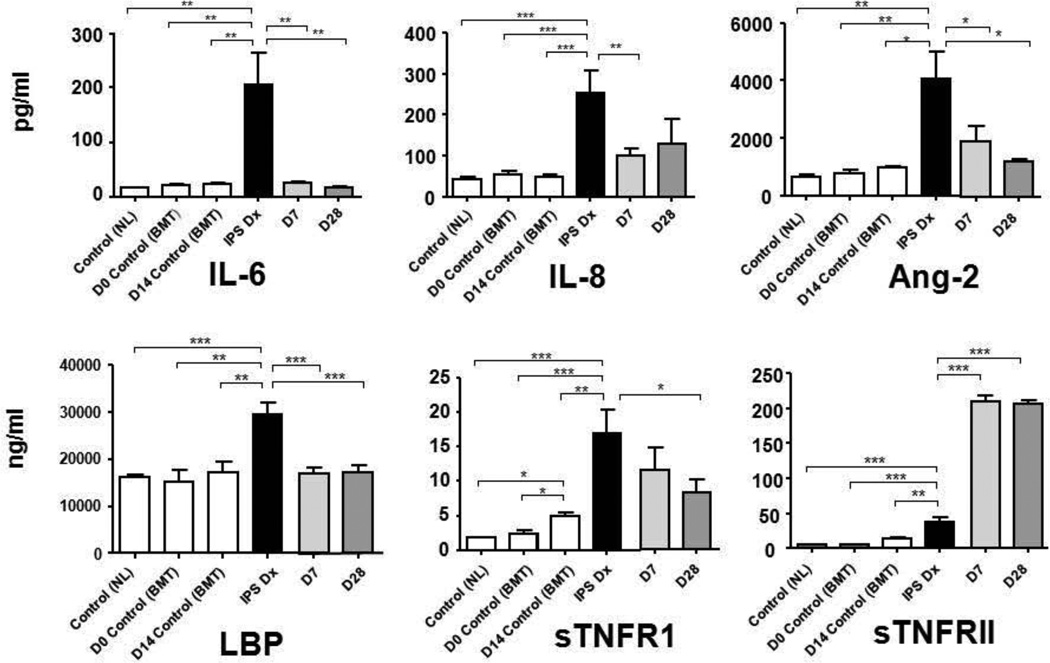
Figure 2.
Plasma biomarkers in IPS.
Plasma protein levels were analyzed from patient samples collected at the time of IPS diagnosis (IPS Dx), day 7 (D7) and day 28 (D28) of study. Two control groups were included, (1) healthy, non-transplant patients [Control(NL)], and (2) allogeneic transplant recipients without complications [(Control(BMT)]. Plasma samples from Control(BMT) were analyzed at day 0 and day 14 post-transplant, the day 14 time point chosen to approximate the time of onset of IPS. Data are expressed as mean ± SEM. Significant differences between groups are shown as * p<0.05, ** p< 0.01, *** p<0.001

