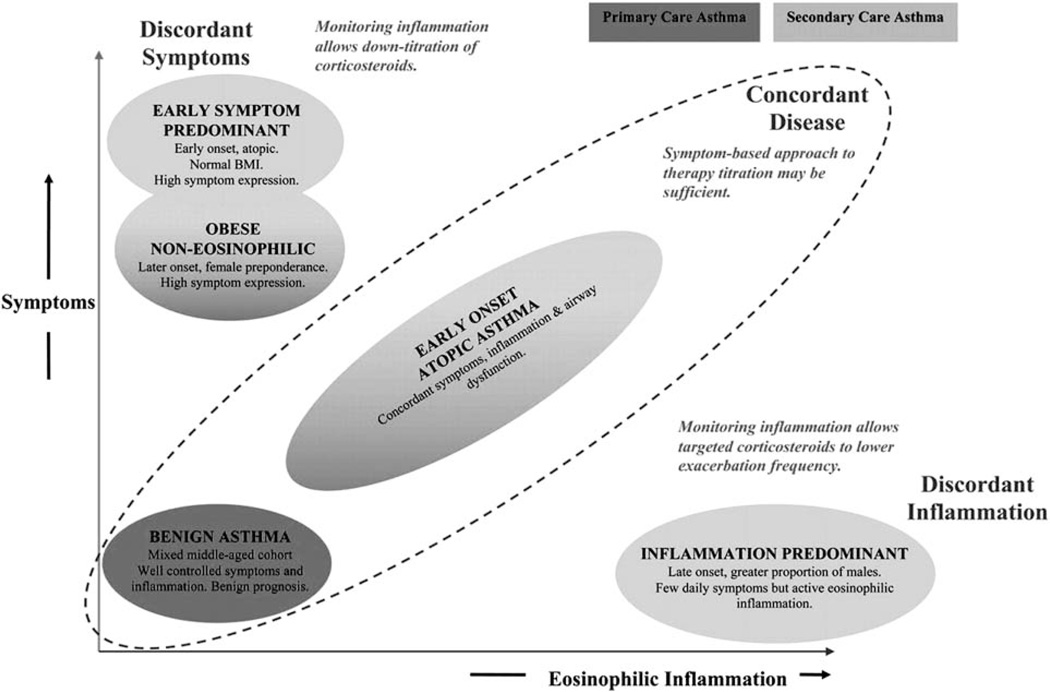
FIGURE 2.
Clinical asthma phenotypes identified using cluster analysis in primary-care and secondary-care asthma populations. The clusters are plotted according to their relative expression of symptoms and inflammation. Reprinted with permission of the American Thoracic Society. Copyright © 2012 American Thoracic Society.13 Copyright American Thoracic Society, New York. All permission requests for this image should be made to the copyright holder.

