
Figure 5.
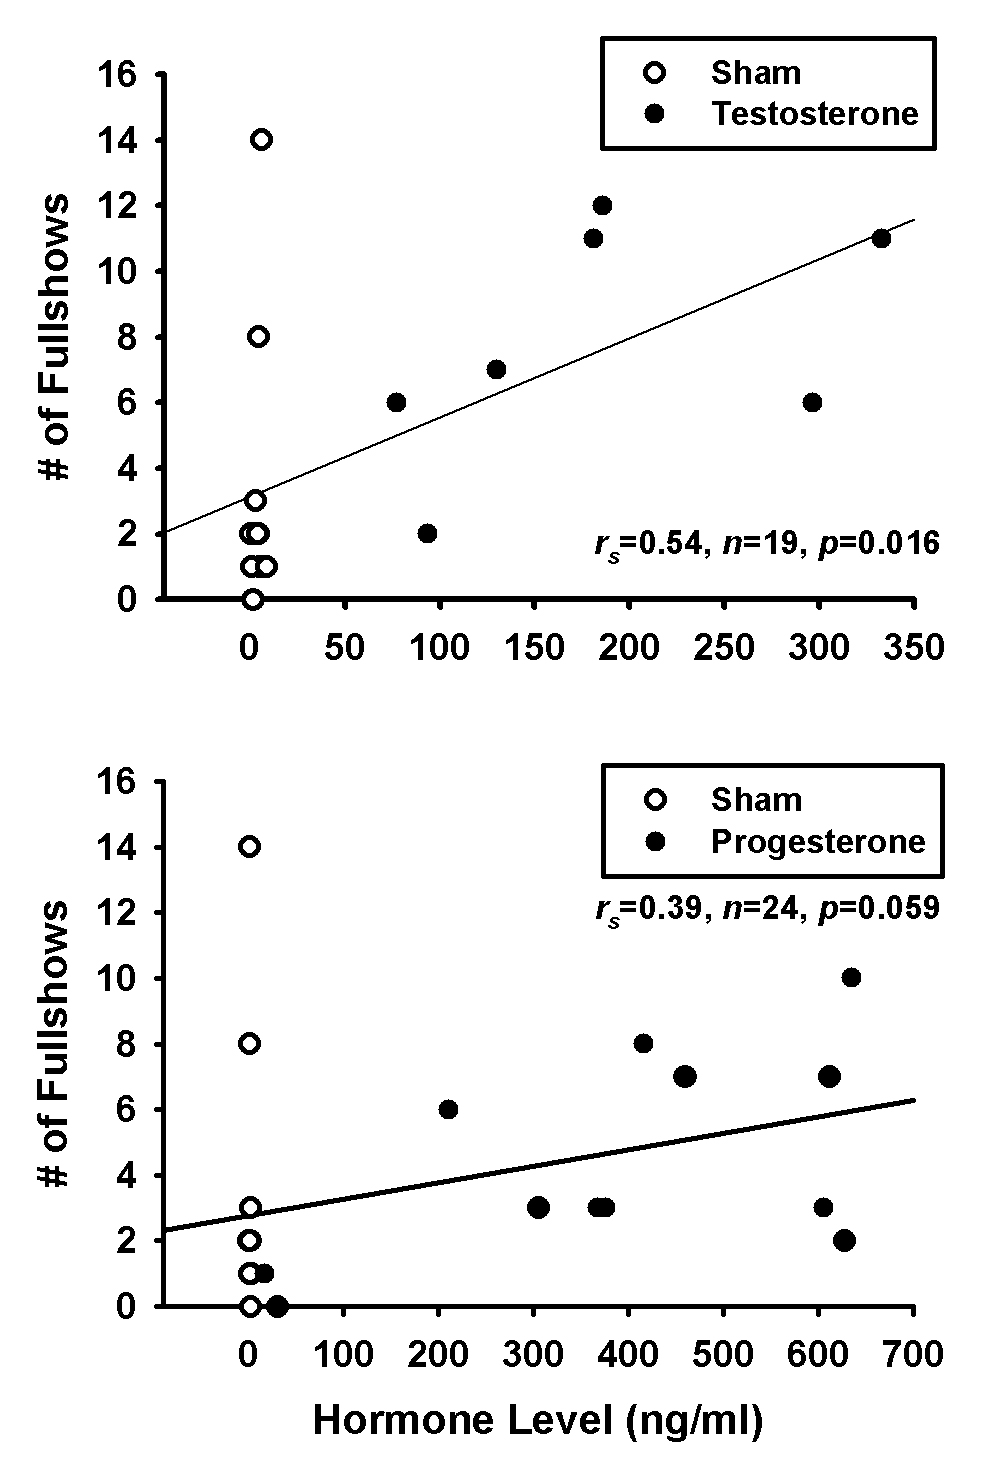
Scatterplots of Spearman's correlations between (Top) testosterone or (Bottom) progesterone level and frequency of fullshow displays.
Official websites use .gov
A
.gov website belongs to an official
government organization in the United States.
Secure .gov websites use HTTPS
A lock (
) or https:// means you've safely
connected to the .gov website. Share sensitive
information only on official, secure websites.
Scatterplots of Spearman's correlations between (Top) testosterone or (Bottom) progesterone level and frequency of fullshow displays.