Figure 2.
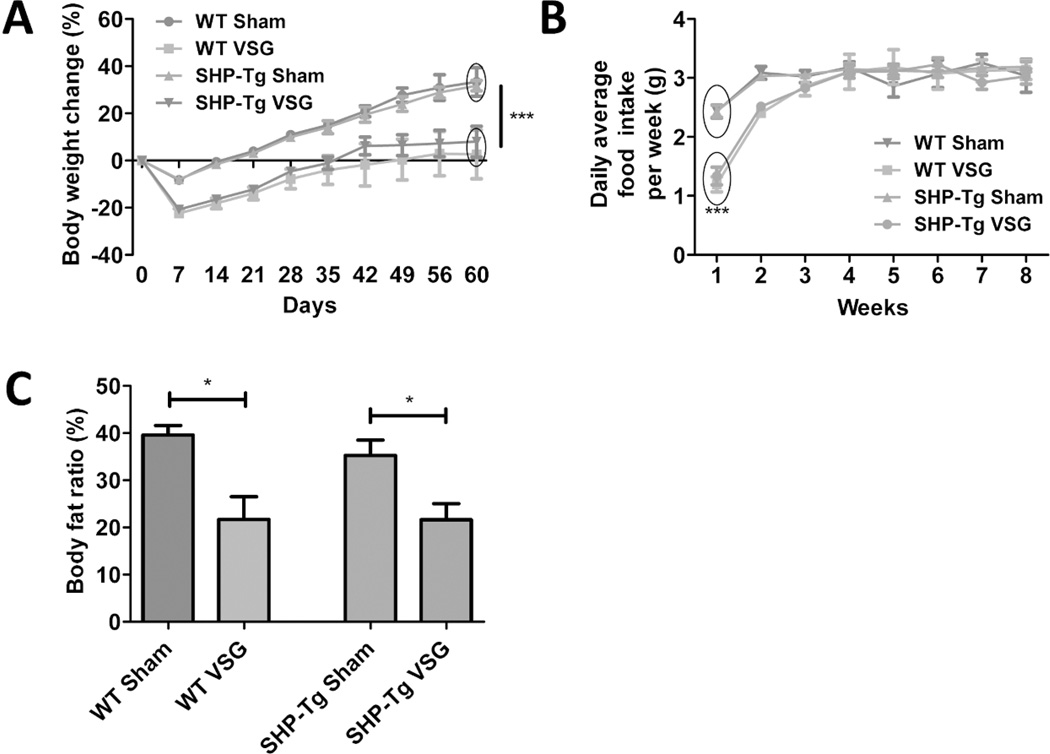
A. Body weight change over the 60 days post-surgery period in WT Sham, WT VSG, SHP-Tg Sham and SHP-Tg VSG groups.
Both VSG groups lost more weight post-surgery and gained significantly less compared to Sham groups. No difference was observed between SHP-Tg VSG and WT VSG mice in terms of body weight gain post-surgery. N: WT Sham=5, WT VSG= 6, SHP-Tg Sham=6, SHP-Tg VSG =7. (***=p<0.0001, two-way ANOVA).
B. Daily average food intake per week.
VSG groups consumed less food compared to Sham groups only during the first week post-surgery. N: WT Sham=5, WT VSG= 6, SHP-Tg Sham=6, SHP-Tg VSG =7. (***=p<0.0001, two-way ANOVA).
C. Body fat ratio at 49 days post-surgery.
Body fat ratio was lower in both VSG groups compared to their respective Sham groups. This parameter was not different between SHP-Tg VSG and WT VSG mice. N: WT Sham=5, WT VSG= 6, SHP-Tg Sham=6, SHP-Tg VSG =7. (*=p<0.05, one-way ANOVA).

