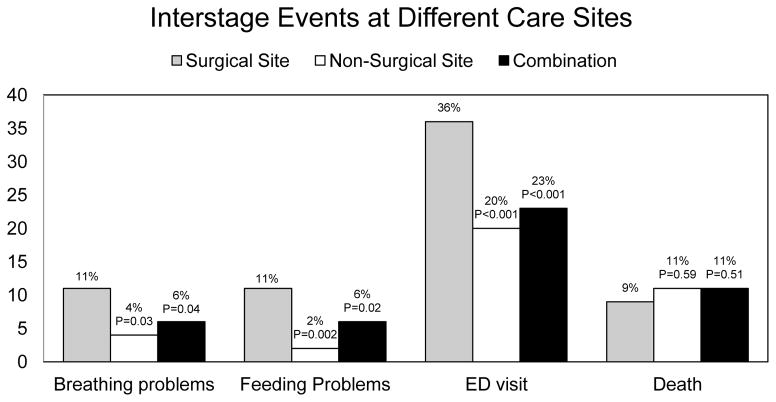
Figure 4.
Comparison of the percentage of patients experiencing interstage events by site of interstage care. Grey bars represent those followed only at the surgical site. White bars represent those followed exclusively at a non-surgical site. Black bars represent those followed at a combination. P-values are noted above their respective bars

