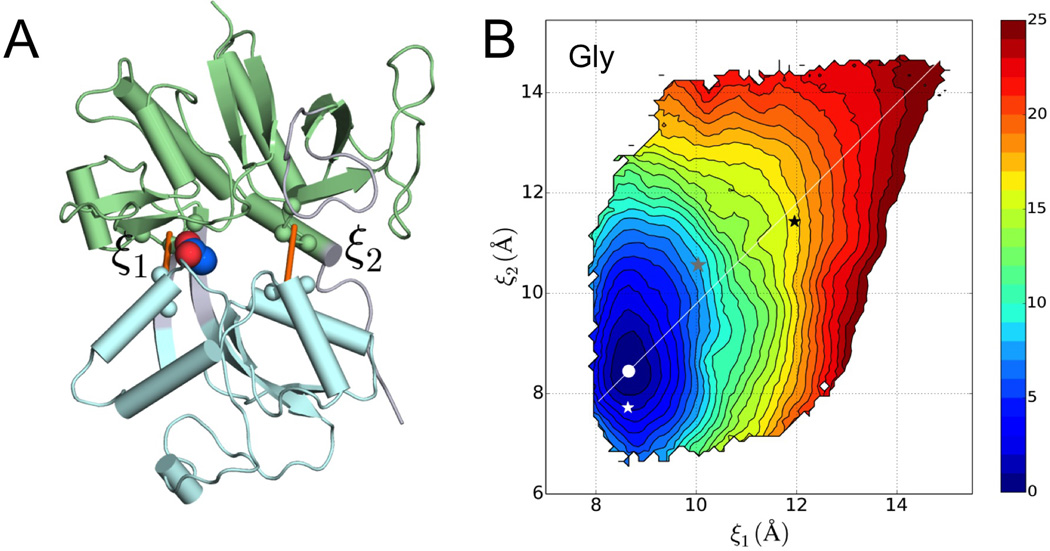
Figure 2. Reaction coordinates and the free energy surface of the glycine-bound GluN1 LBD.
(A) Two inter-lobe distances, ξ1 and ξ2, are defined to describe the relative motion between the lobes. The view is directly into the domain cleft, with D1 in green and D2 in cyan.
(B) Free energy surface of the Gly-bound GluN1 LBD, presented as contours. The free energy minimum is highlighted by a white dot. Also shown are (ξ1c, ξ2c) values calculated on the crystal structures of the LBD bound with three ligands: Gly (white star; PDB 1PB7), CLE (gray star; PDB 1Y1M), and DCKA (black star; PDB 1PBQ). The coordinate with fixed at (ξ1m – ξ2m)/2 is shown by a white line.
See also Table S1.

