
Figure 3.
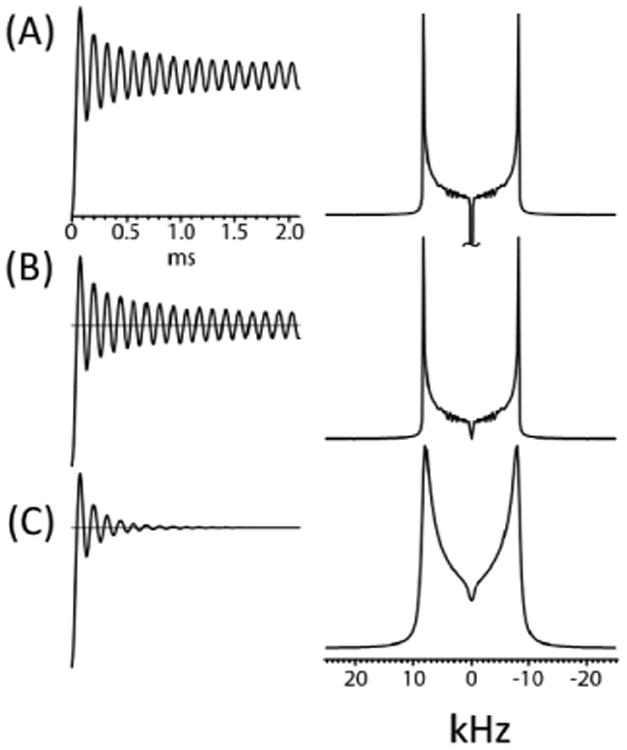
A simple data processing procedure to surpress axial peaks in 2D CPVC SLF spectra. Time-domain signals (left) and corresponding Fourier-transformed frequency spectra (right). (A) An oscillating buildup curve from CPVC before (A) and after compensation for the DC offset without (B) and with (C) apodization.