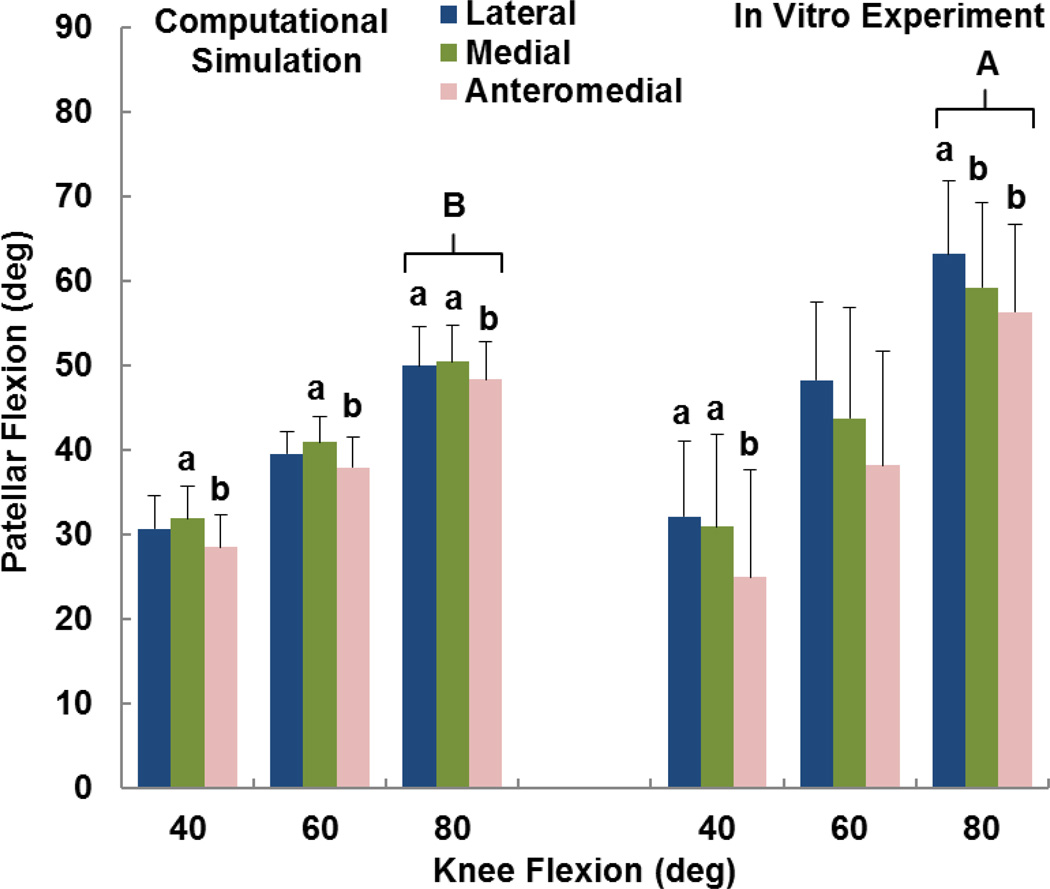
Figure 2.
Average (+ standard deviation) patellar flexion from computational simulation and the in vitro experimental study. Significant differences at a flexion angle due to altering the position of the tibial tuberosity are marked with different small letters (a > b). A significant difference between the experimental and computational data at 80° of flexion is also marked (A > B).

