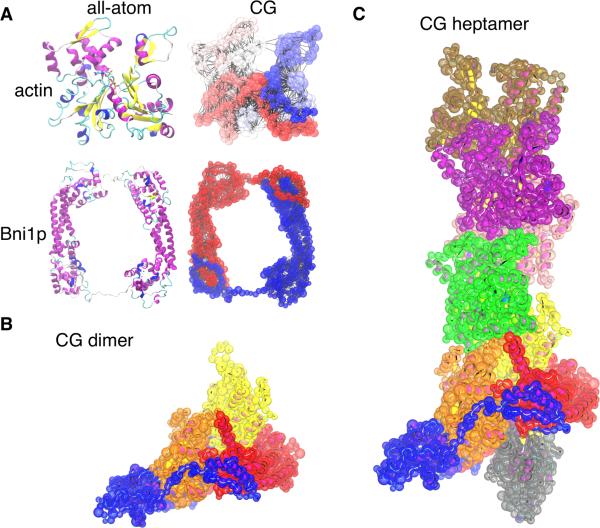
Figure 4. Coarse-grained (CG) model of formin and actin.
(A) Ribbon diagrams of the backbones of all-atom models of actin and Bni1p next to their CG hENM models. In the actin CG model, the color scale represents the residue number (dark blue is the N-terminal end, and dark red is the C-terminal end). In the formin CG model, FH2L is colored blue and FH2T is colored red. Lines connect CG sites within 10 Å, as in the hENM model. The varying CG site sizes represent the radii used for the LAMMPS excluded volume terms. (B and C) Models with the CG beads superimposed on the all-atom ribbon diagrams of the protein backbones. Bead sizes represent the excluded volume radii, as in (A). (B) Model of the CG dimer system, consisting of the formin dimer and two actin subunits extracted from the filament model. (C) Model of the formin dimer with the actin 7-mer filament.

