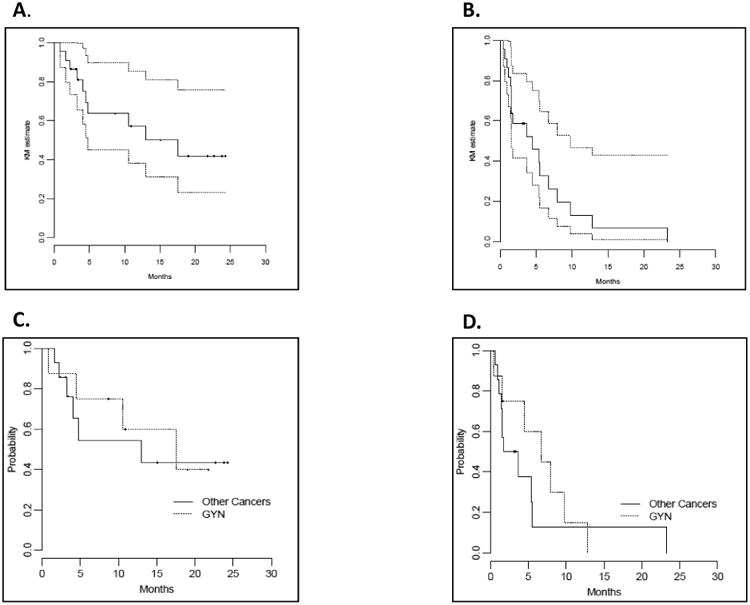
Figure 1. Overall survival (OS) and progression-free survival (PFS): all patients by ovarian versus non-ovarian cancers.

Kaplan-Meier survival curves of OS (A) and PFS (B) in all patients and OS (C) and PFS (D) by ovarian and non-ovarian cancers.

Kaplan-Meier survival curves of OS (A) and PFS (B) in all patients and OS (C) and PFS (D) by ovarian and non-ovarian cancers.