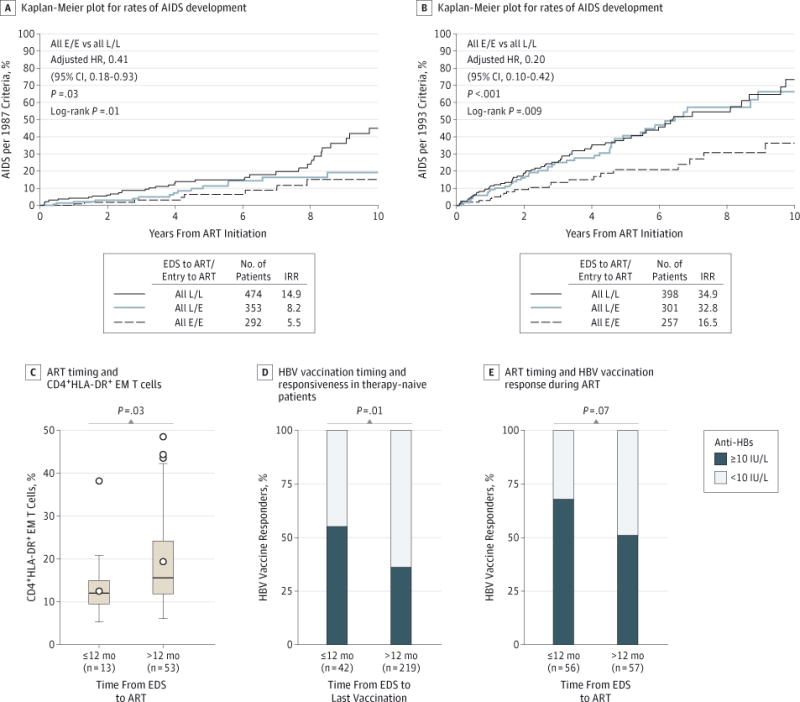
Figure 5. Association of Antiretroviral Therapy (ART) Timing With Development of AIDS and Duration of Untreated Infection With T-Cell Activation and In Vivo Functional Responses.

A and B, Kaplan-Meier plots depict progression to AIDS in participants who were classified to the E/E, L/E, and L/L time-indexed subsets shown in Figure 4. Incidence rate ratios (IRRs) and hazard ratios (HRs) were adjusted for the calendar year of ART, higher vs lower CD4+ counts at study entry and pre-ART, ART regimen, interval from ART initiation to viral load (VL) suppression, and duration of VL-suppressive ART. Data in panel A were derived from 1119 US Military HIV Natural History Study (NHS) participants; data in panel B were derived from 956 NHS participants because individuals with pre-ART CD4+ counts of less than 200 cells/μL (n = 163) were excluded from these analyses. C, Association of the duration between estimated date of seroconversion (EDS) and ART initiation with the percentage of CD4+HLA-DR+ effector memory (EM) T cells in participants receiving VL-suppressive ART. The box-and-whisker plots depict the median (horizontal line in box), upper and lower quartiles (ends of box), and extremes (symbols outside of box). The symbols inside the boxes indicate the mean. D, The proportion of the responders (filled box) vs nonresponders (open box) to hepatitis B virus (HBV) vaccine in HIV-infected patients who received the vaccine while they were therapy naive within or after 12 months of the EDS. E, The proportion of the responders (filled box) vs nonresponders (open box) to HBV vaccine in HIV-infected patients who received the vaccine while receiving VL-suppressive ART; patients were stratified according to whether VL-suppressive ART was initiated within or after 12 months of the EDS. Anti-HBs indicates HBV surface antibody.
