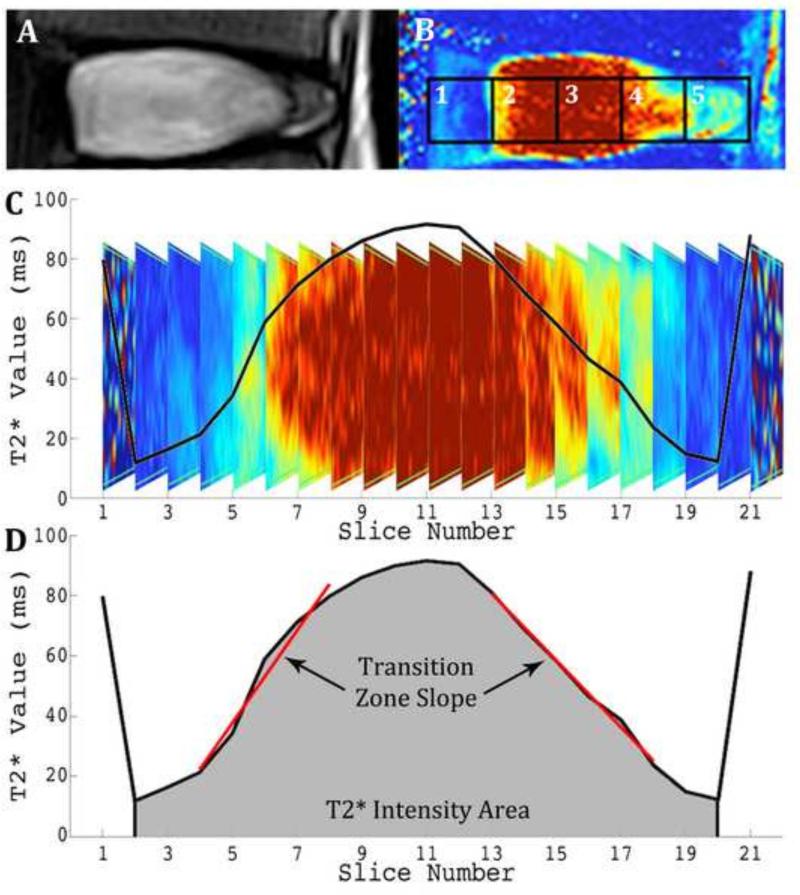
Figure 1. Quantification of imaging parameters, transition zone slope, and T2* intensity area, from T2* relaxation profile in the coronal plane of region of interest (ROI) 3.
A: Traditional T2 weighted MR image of healthy disc. B: Same disc imaged with T2* protocol and five ROI's identified. C: Coronal profile of healthy disc with plot of average T2* relaxation time (ms) overlaid. D: Corresponding quantification of transition zone slope and T2* intensity area of the healthy disc. Reprinted with permission (Ellingson et al., 2013).

