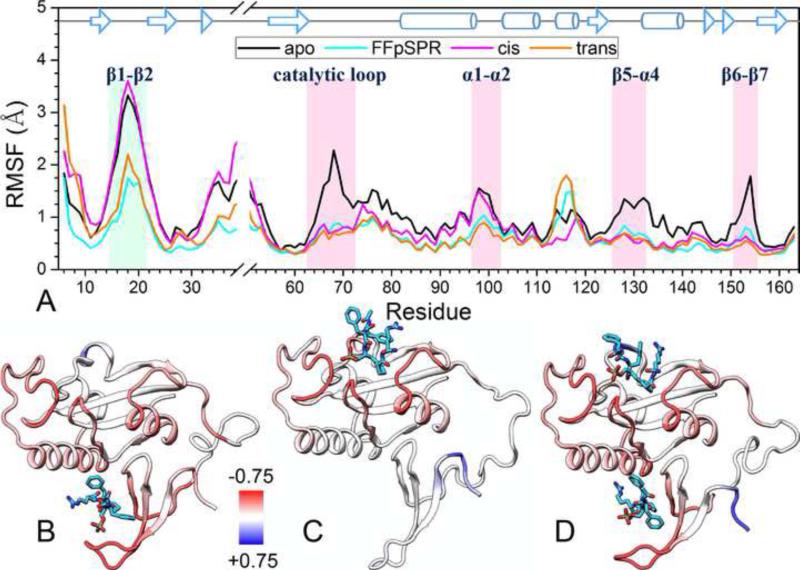
Figure 3. Backbone fluctuations in the absence and presence of ligands.
(A) The Cα RMSFs of individual residues in the last 40 ns. Loops with high flexibility in the apo form are highlighted by shading. The α3 helix, which is a less stable 310 helix, also shows high flexibility.
(B–D) Differences in RMSFs of the ligand-bound forms from those of the apo form are colored on the bound conformations of Pin1. Red and blue colors represent lower and higher flexibilities, respectively, in the bound forms.
See also Figures S4, S5, S6, and S8.

