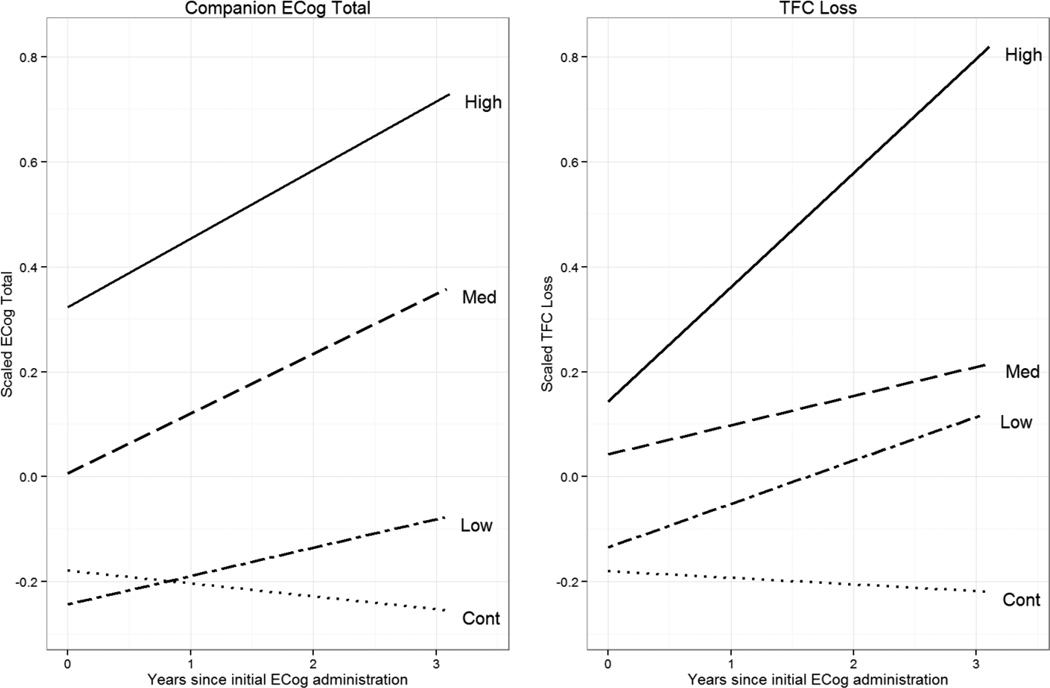
Figure 2.
Fitted linear mixed effects regression (LMER) curves by group for scaled companion Everyday Cognition (ECog) and Total Functional Capacity (TFC) loss scores.
Cont = control; Med = medium.
All model coefficients were estimated adjusting for gender, age at baseline, and years of education. The plots show the scaled companion ECog and TFC loss scores as a function of duration and group.

