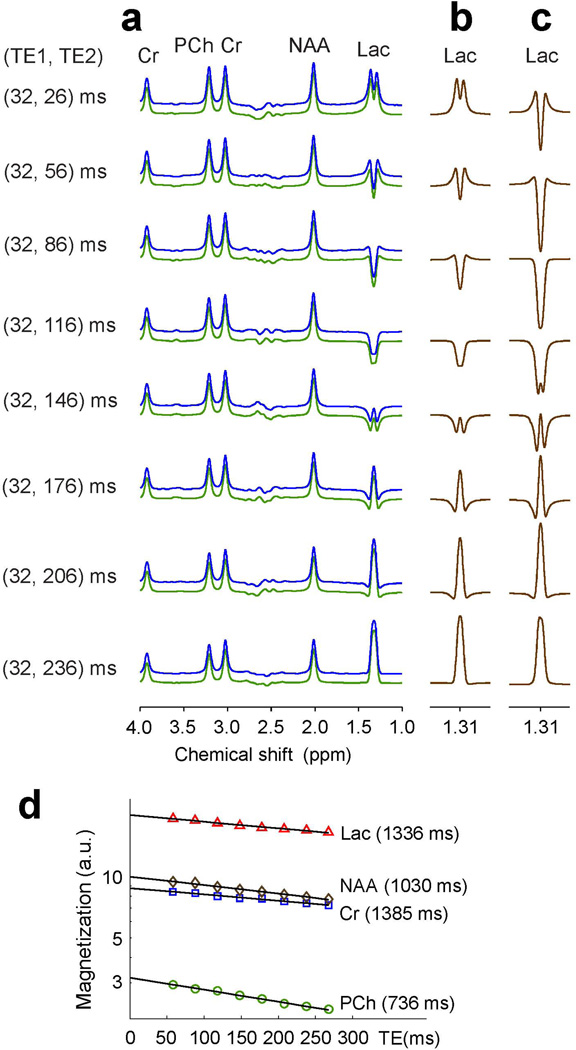
Figure 1.
(a) In vitro spectra at eight pairs of the first and second subecho times TE1 and TE2 of PRESS are presented together with LCModel fits and residuals. The phantom contained Lac (20 mM), PCh (3.3 mM), Cr (9 mM), and NAA (10 mM). Spectra were broadened to singlet linewidth (FWHM) of 6 Hz. (b, c) Numerically-calculated Lac 1.31 ppm signals at the 8 TEs. Spectra were calculated incorporating the PRESS slice-selective RF and gradient pulses in (b), and calculated for a hard RF pulse dual-echo sequence in (c). The Lac signals were scaled with respect to calculated Cr signal for the same Lac-to-Cr concentration ratio as in the phantom solution, neglecting T2 effects. (d) Phantom T2 evaluation of Lac, PCh, Cr, and NAA by monoexpoential fitting of LCModel estimates versus TE. The estimated T2 values are shown in brackets.

