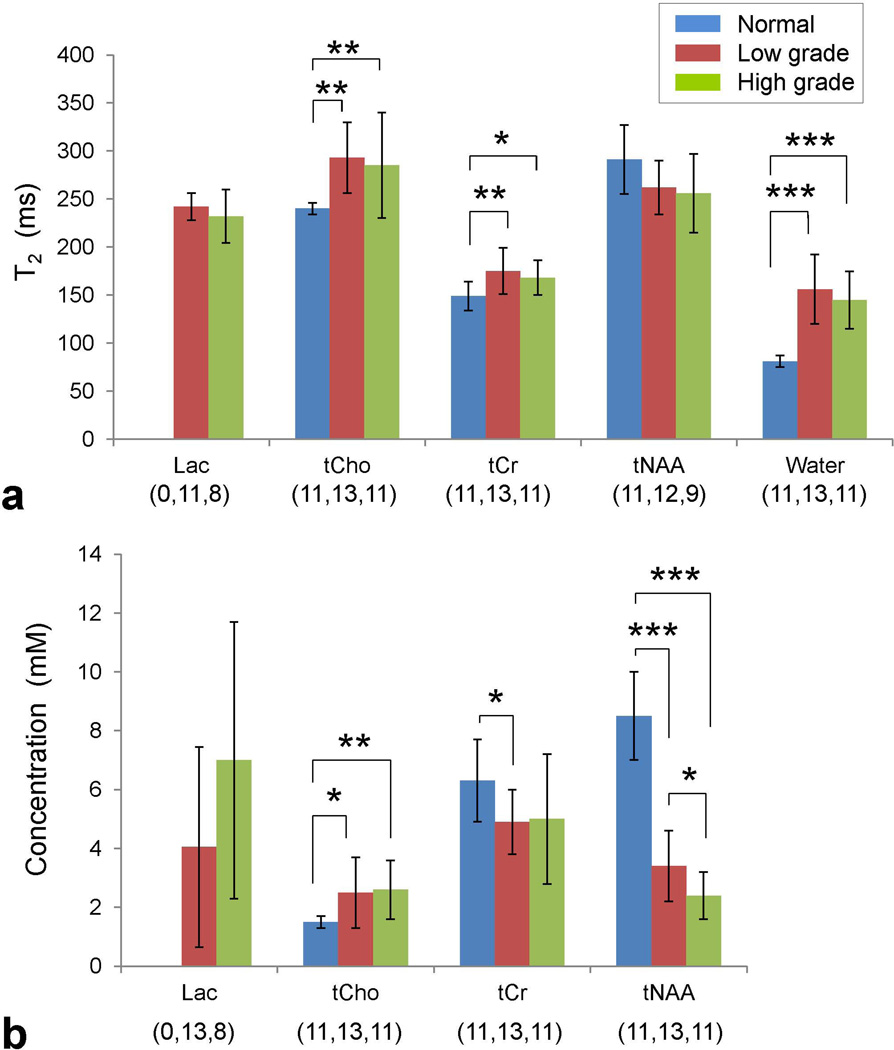
Figure 3.
(a) Group comparison for the mean T2s of Lac, tCho, tCr, tNAA, and water for normal appearing brain, low grade and high grade gliomas. Error bars indicate standard deviation. Statistical significance is indicated with asterisks (* for 0.01 < p ≤ 0.05; ** for 0.001 < p ≤ 0.01; *** for p ≤ 0.001). The numbers in brackets denote the sample size for the normal brain, low grade and high grade tumor groups. (b) The mean concentrations of the metabolites, estimated from zero-TE magnetization, are shown with standard deviation.

