Figure 3.
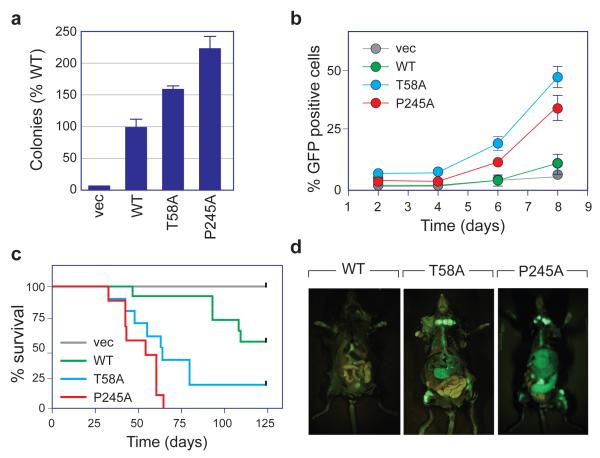
The P245A tumor-mutation activates the oncogenic potential of MYC. (a) NIH3T3 cells, engineered to express the indicated MYC proteins, or vector control (vec), were grown in soft-agar. 23 After 21 days, colonies were counted, and colony numbers expressed relative to WT MYC. Data are presented as mean ± SEM (n=3). (b) Primary mouse fetal liver cells were transduced with MSCV–MYC–IRES–GFP vectors to express the indicated MYC proteins (or vector control), together with an IRES-driven green fluorescent protein (GFP). Transduced cells were then cultured under conditions that promote pre-B cell expansion, 18 harvested at the indicated times, and GFP-positive cells scored by FACS. Data are presented as mean ± SEM (n=6). Significance for (a) and (b) was established by comparing the effects of WT and mutant MYC proteins using Student’s t-test. (c) Kaplan–Meier survival curves of irradiated mice reconstituted with wild-type hematopoietic stem cells expressing the indicated MYC proteins (or vector control). 9 Kaplan–Meier curves were analyzed using the Log-rank test and statistical significance established via Chi-square analysis. The T58A (n=10) and P245A (n=9) MYC proteins drive tumorigenesis with a significantly (p<0.01) reduced latency (~50 days) compared to WT MYC (n=10, >100 days). The difference between T58A and P245A MYC is not significant. (d) Photos of representative mice from (c), imaging GFP-expressing cells. All mouse experiments were performed in compliance with US Federal laws and with approval of the Cold Spring Harbor Laboratory Animal Care and Use Committee.

