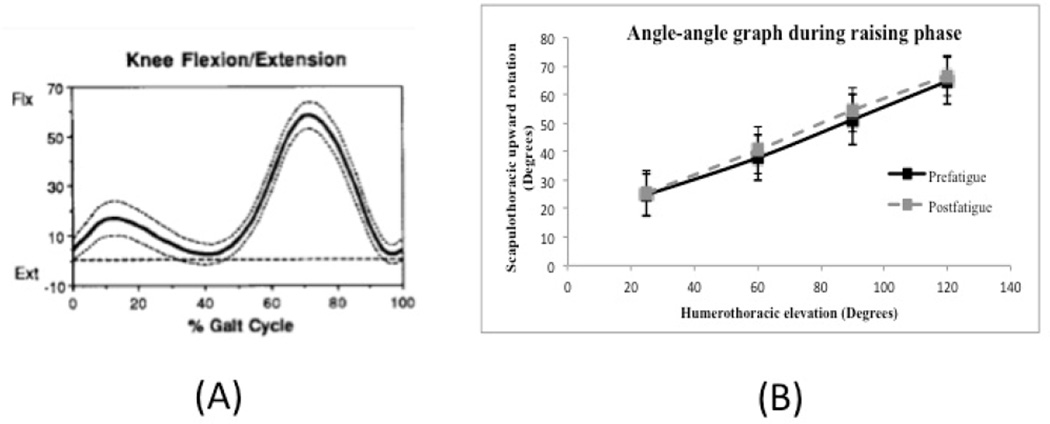
Figure 1.
Examples of graphs used to study movement patterns. (A) Knee motion curve that provides only angular motion of one segment during gait cycle. Mean knee angle (solid line) and one standard deviation (dotted lines) in sagittal plane during gait cycle in adults (Kadaba et al., 1990). (B) Angle-angle graph comparing prefatigue and postfatigue scapular upward rotation and standard error of the mean at 30°, 60°, 90°, and 120° of hum eral elevation. It should be noted that the solid and dashed lines on the graph simply connect one data point to another and are not representative of actual data or movement patterns between plotted points.

