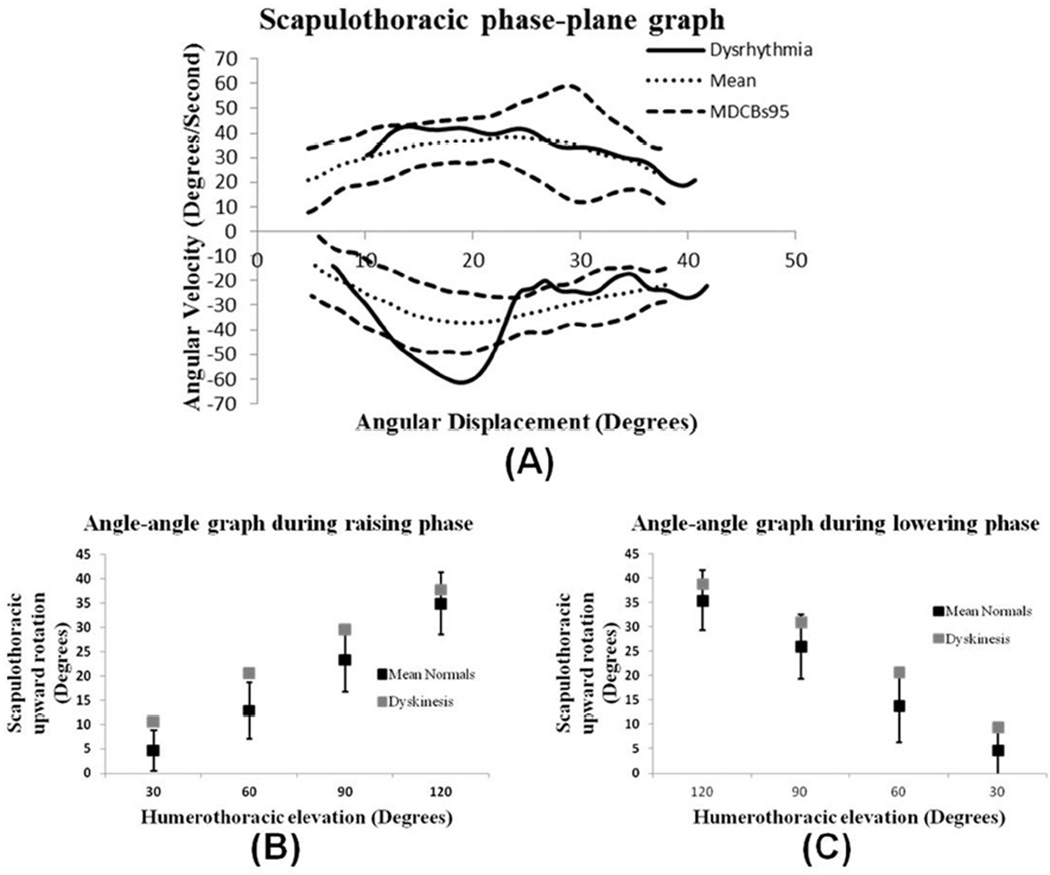
Figure 4.
Angle-angle and phase-plane graphs derived from individuals with typical scapulohumeral rhythm and scapular dysrhythmia. (A) Scapular upward rotation phase-plane graph. Dotted lines represent mean (n = 8) typical movement pattern; dashed lines represent 95% MDCB. Solid line represents movement pattern of individual with observed scapular dysrhythmia during the lowering phase of arm elevation. (B, C) Scapular upward rotation vs. humeral elevation of the same data plotted at 30°, 60°, 90°, and 120° of humeral elevation during both the raising (B) and lowering (C) phases of arm elevation. Black squares represent mean (n = 8) typical movement pattern +/− standard deviation; gray squares represent movement pattern of individual with scapular dysrhythmia during the lowering phase of arm elevation.

