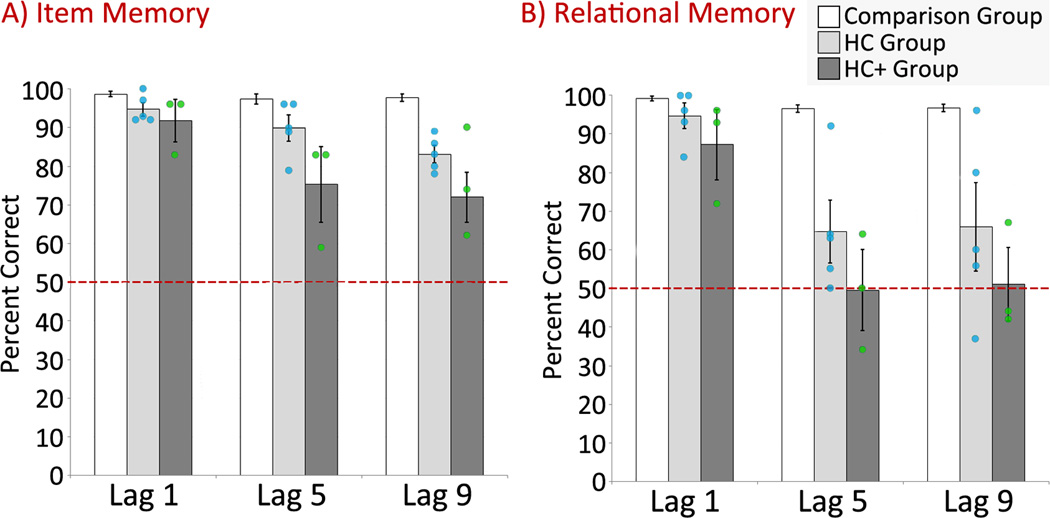
Figure 3.
Percent correct on the tests of item (a) and relational memory (b) for the comparison group (white bars), for patients with damage limited in large part to the hippocampus (light gray bars), and for patients with extensive MTL damage (dark gray bars). The performance of individual patients from the HC and HC+ groups are illustrated with blue and green circles, respectively. Standard error bars are plotted around the mean and the dashed line represents chance performance.

