
Figure 1.
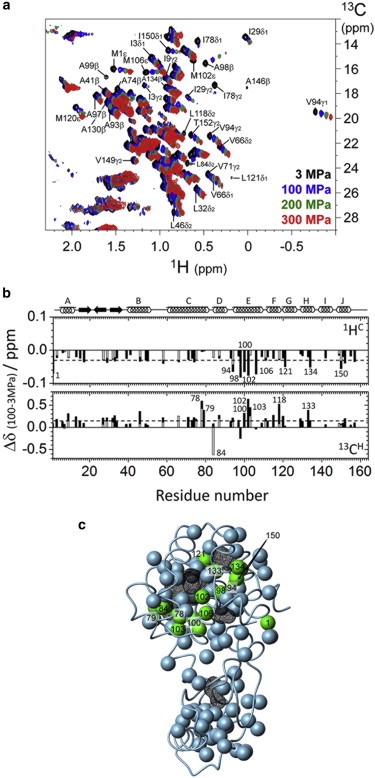
Effects of pressure on L99A T4 lysozyme. (a) 1H/13C HSQC spectra at different pressures: 3 MPa (black), 100 MPa (blue), 200 MPa (green), and 300 MPa (red) for a 1 mM uniformly 13C- and 15N-labeled protein at 25°C in 50 mM phosphate buffer (pH 6.0, 10% 2H2O/90% 1H2O mixture (v/v)) containing 25 mM NaCl. (b) Pressure-induced chemical shift changes in the low-pressure region (Δδ = δ100MPa – δ3MPa). Chemical shift changes of the methyl proton 1HC and the methyl carbon 13CH are plotted along with the residue number. The average values of the pressure shift are −0.03 for 1HC and 0.19 for 13CH, as shown by the dotted lines. Residues showing large pressure-induced chemical shift changes are represented by the residue numbers. The α-helix and β-strand regions are indicated by rings and arrows, respectively, at the top of the panel. (c) Methyl groups showing large pressure-induced shifts (Δδ > |0.05| ppm for 1HC and/or Δδ > |0.3| ppm for 13CH) are depicted by green spheres on the tertiary structure of the L99A mutant (PDB ID: 1L90), whereas the less pressure-sensitive methyl groups are depicted by gray spheres. The internal cavities are drawn with a black wire frame cage calculated using a 1.4 Å probe and the program MOLMOL (54). To see this figure in color, go online.