
Figure 2.
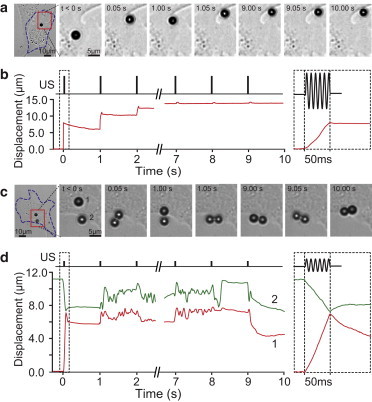
Displacements of AcLDL microbubbles attached to an NIH 3T3 fibroblast during SB-ATC and TB-ATC. (a) Selected images at different time points, showing a single AcLDL microbubble subjected to ultrasound pulses in SB-ATC. (b) Temporal evolution of the lateral displacement of the bubble in panel a. Inset: zoomed-in plot of the displacement during the first ultrasound pulse with a duration of 50 ms. (c) Selected images at different time points, showing a pair of AcLDL microbubbles during application of TB-ATC. (d) Temporal plots of the paired displacements of the two bubbles in panel c during TB-ATC. Inset: zoomed-in plot of the paired displacements during the first ultrasound pulse of 50 ms duration. Ultrasound parameters for a and b: center frequency 1.25 MHz, acoustic pressure 0.05 MPa, duration of each pulse 50 ms, and PRF 1 Hz. Ultrasound parameters for c and d: center frequency 1.25 MHz, acoustic pressure 0.015 MPa, pulse duration 50 ms, and PRF 1 Hz. To see this figure in color, go online.