
Figure 7.
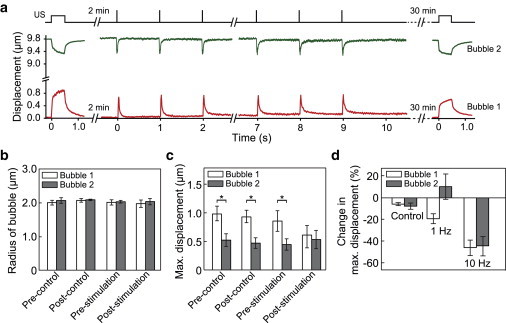
Dual-mode TB-ATC probing and stimulation of hMSCs. (a) Schematic of dual-mode TB-ATC and representative microbubble displacements. (b and c) Radius (b) and maximum displacements (c) of the paired microbubbles before and after TB-ATC stimulation for experimental (n = 12) and control (n = 14) groups. Error bars represent mean ± SE. ∗p < 0.05, Student’s t-test. Ultrasound parameters for a–c: center frequency 10 MHz, acoustic pressure 0.07 MPa and pulse duration 0.5 s for pre- and poststimulation probing, acoustic pressure 0.12 MPa, pulse duration 10 ms, PRF 1 Hz, total duration 10 s for stimulation. (d) Change of maximum displacement for each of bubbles subjected to TB-ATC stimulation with PRF of 1 or 10 Hz. To see this figure in color, go online.