
Figure 5.
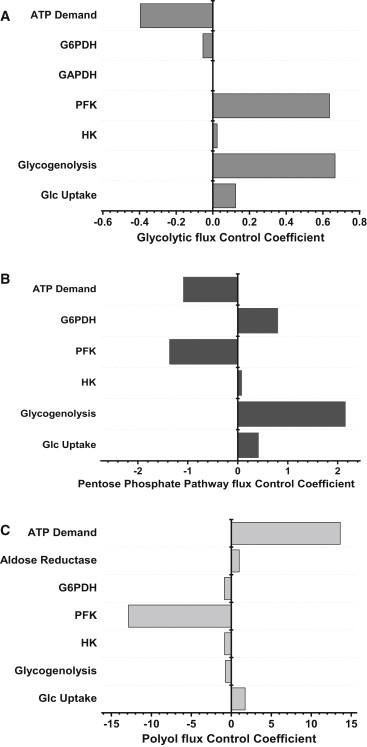
Control of the glucose fluxome in the heart. The flux control coefficients of the most rate-controlling steps of glucose catabolism are displayed. The bar length indicates the x-axis magnitude of the flux control coefficient (CC) of glycolysis (A), PP (B), and polyol (C) pathways. The corresponding enzymatic steps are indicated at the left of each bar plot. The flux CC can be either positive or negative, and in all cases it was verified that the sum of the CC = 1.0, in compliance with the summation theorem.