
Figure 3.
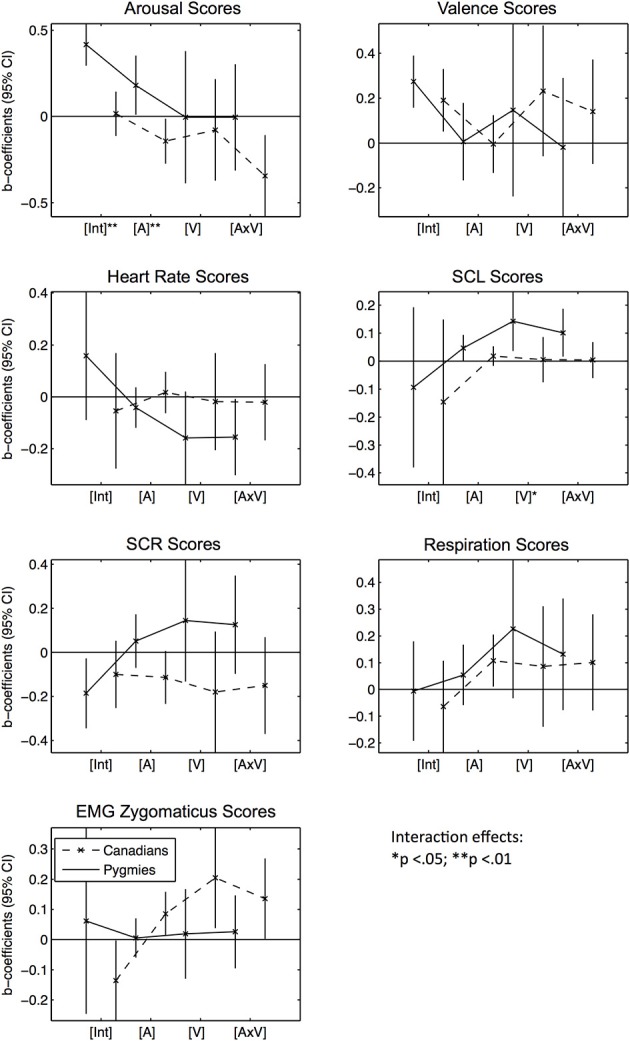
Error bar graphs of fixed effect coefficients estimated for Pygmy music excerpts' arousal and valence ratings separated by participant group and response score types. CI, confidence interval; [Int], Intercept; [A], Mean arousal rating of excerpt by Pygmy participant group; [V], Mean valence rating of excerpt by Pygmy participant group; [V × A], Interaction effect between [A] and [V]. The solid line represents effect estimates for Pygmies, the dashed line represents effects for Canadians. Asterisks indicate significance of fixed effect differences between Pygmy and Canadian groups: *p < 0.05, **p < 0.01 (two sided t-tests).