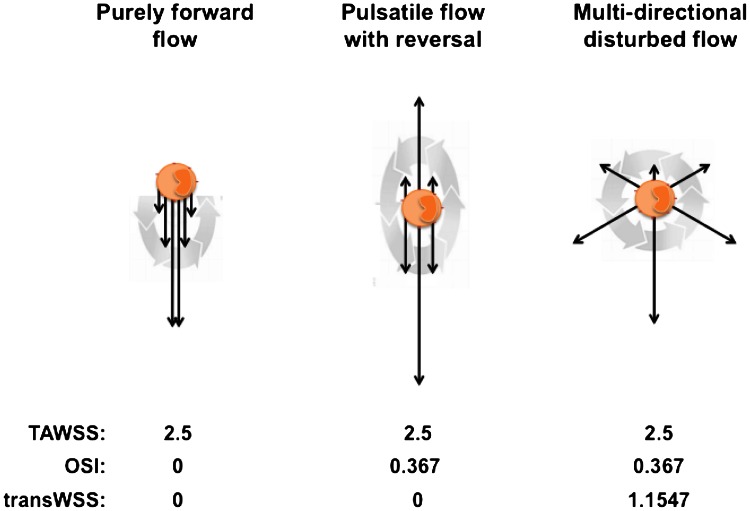
Figure 1.
Three different flow environments to which an EC could be exposed. The black arrows represent WSS vectors at various times in the cardiac cycle. The gray arrows indicate their evolution with time during the cardiac cycle. The table lists TAWSS (Pa), OSI, and transWSS (Pa) for the three environments. Modified from Ref. 26

