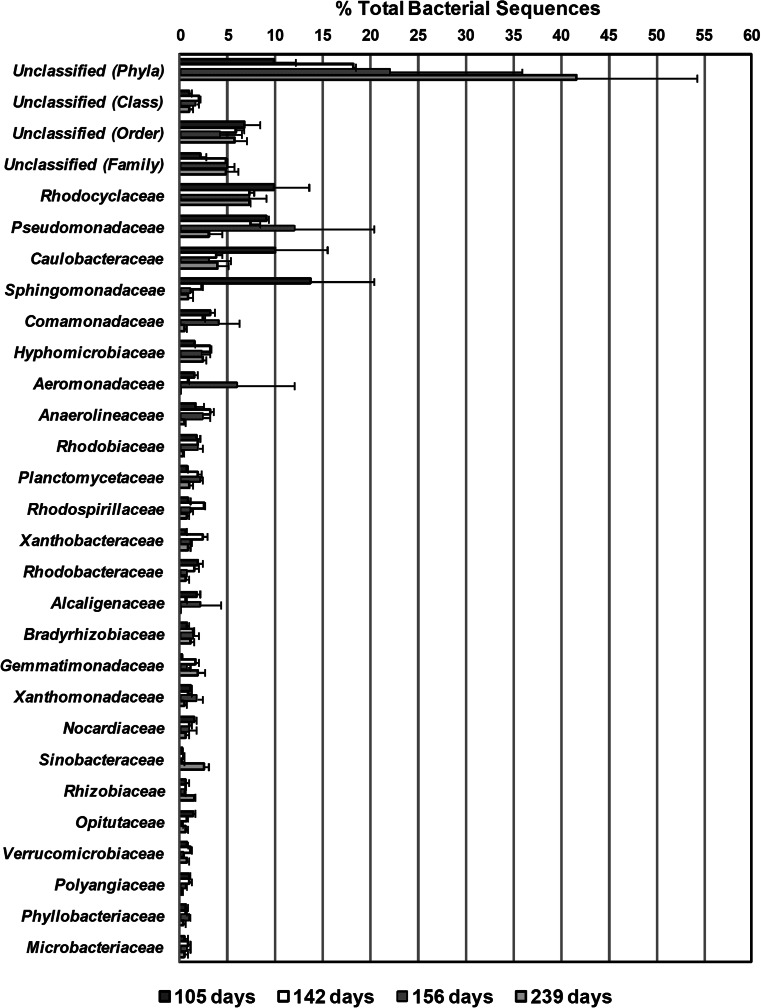
Fig. 4.
Percentage of total bacterial sequences (mean of replicates) from the top 25 abundant detected families in the four sampling time points. Error bars represent the lower and upper values of replicates for each sampling time. Sequences labeled as unclassified (Family) could not be assigned to any particular family using the Ribosomal Database Project Classifier at the selected bootstrap confidence estimate threshold of 50 %

